29
/fr/
fr
AIzaSyAYiBZKx7MnpbEhh9jyipgxe19OcubqV5w
April 1, 2024
72232
Aruba
ABW
true
2
1
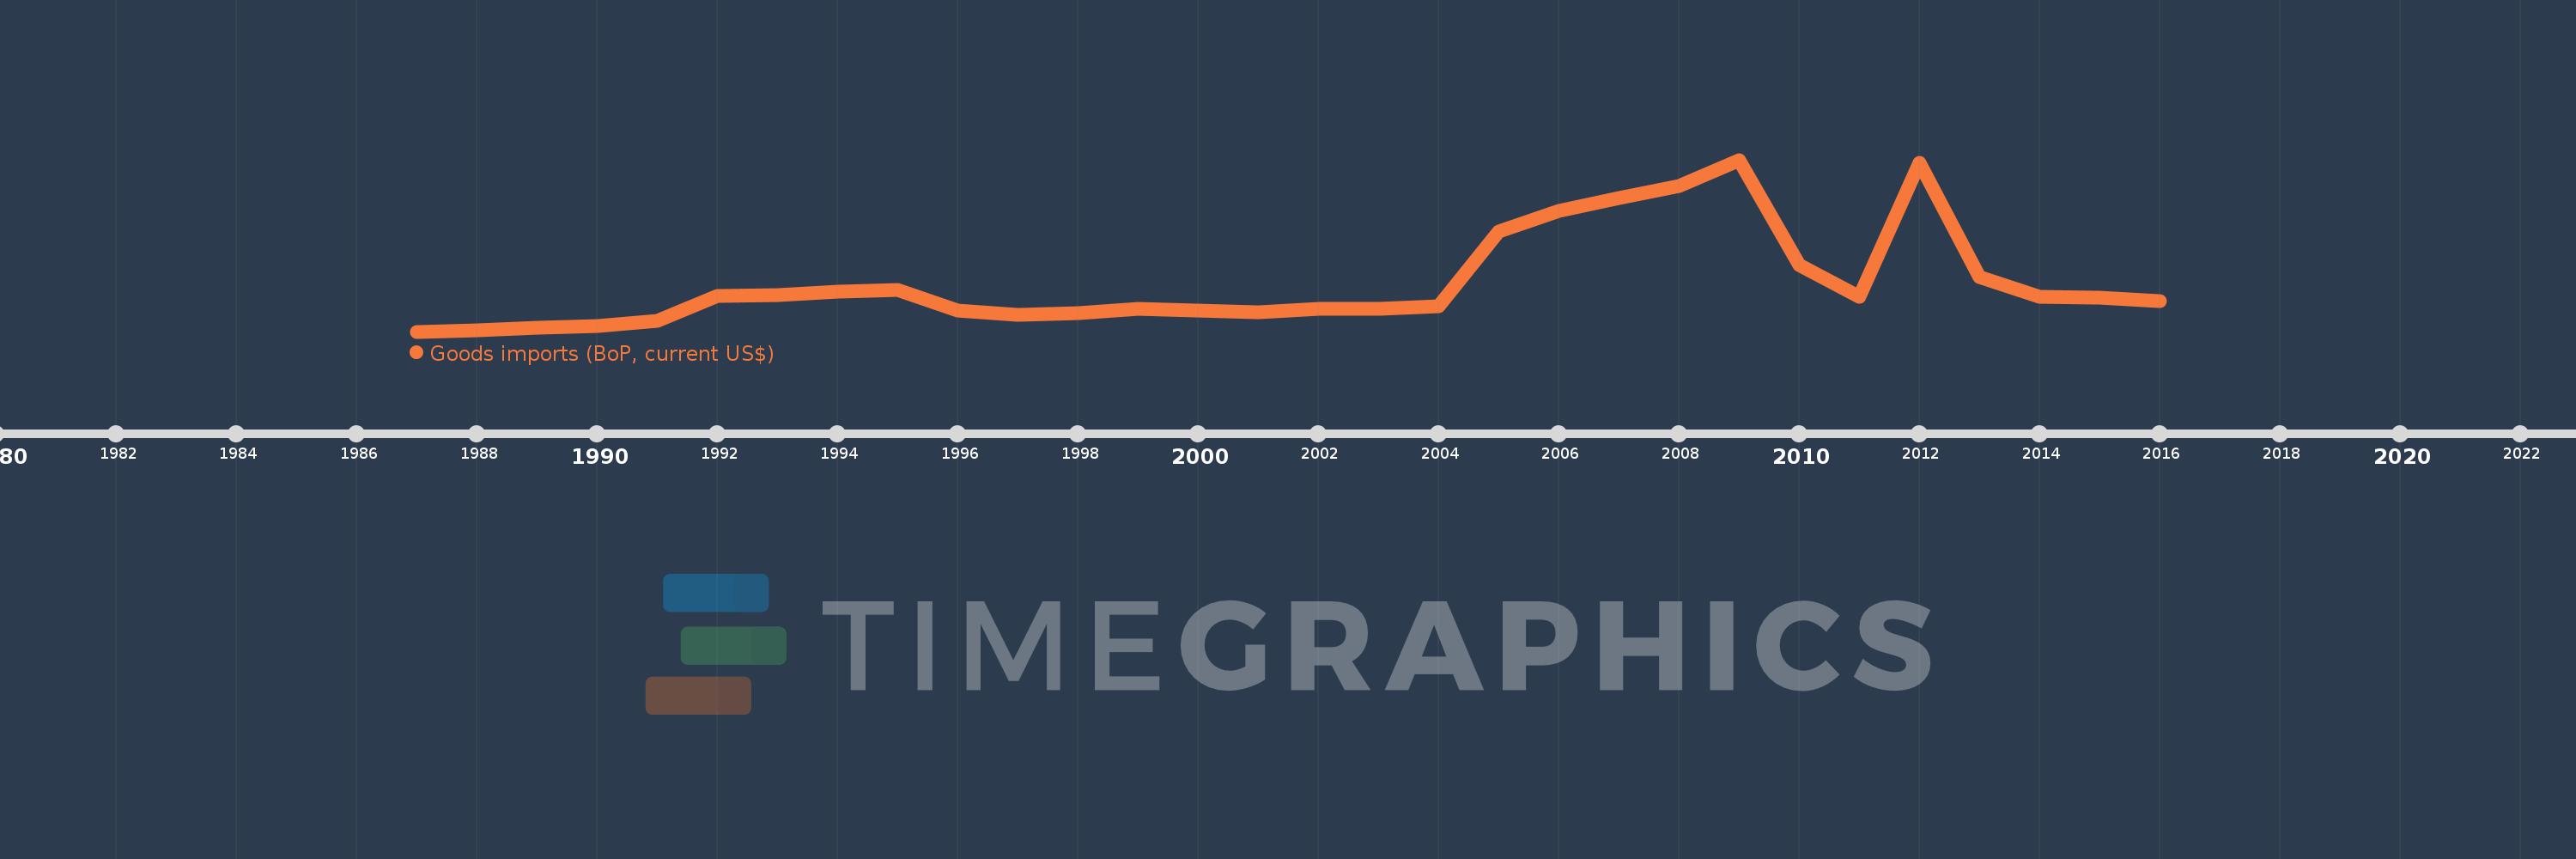
Goods imports (BoP, current US$)
2016,2015,2014,2013,2012,2011,2010,2009,2008,2007,2006,2005,2004,2003,2002,2001,2000,1999,1998,1997,1996,1995,1994,1993,1992,1991,1990,1989,1988,1987
Cette statistique dans les autres pays:
AfghanistanAlbaniaAlgeriaAngolaAntigua and BarbudaArab WorldArgentinaArmeniaArubaAustraliaAustriaAzerbaijanBahamas, TheBahrainBangladeshBarbadosBelarusBelgiumBelizeBeninBermudaBhutanBoliviaBosnia and HerzegovinaBotswanaBrazilBrunei DarussalamBulgariaBurkina FasoBurundiCabo VerdeCambodiaCameroonCanadaCaribbean small statesCentral African RepublicCentral Europe and the BalticsChadChileChinaColombiaComorosCongo, Dem. Rep.Congo, Rep.Costa RicaCote d'IvoireCroatiaCuracaoCyprusCzech RepublicDenmarkDjiboutiDominicaDominican RepublicEarly-demographic dividendEast Asia & PacificEast Asia & Pacific (excluding high income)East Asia & Pacific (IDA & IBRD countries)EcuadorEgypt, Arab Rep.El SalvadorEquatorial GuineaEritreaEstoniaEthiopiaEuro areaEurope & Central AsiaEurope & Central Asia (excluding high income)Europe & Central Asia (IDA & IBRD countries)European UnionFaroe IslandsFijiFinlandFragile and conflict affected situationsFranceFrench PolynesiaGabonGambia, TheGeorgiaGermanyGhanaGreeceGrenadaGuatemalaGuineaGuinea-BissauGuyanaHaitiHeavily indebted poor countries (HIPC)High incomeHondurasHong Kong SAR, ChinaHungaryIBRD onlyIcelandIDA & IBRD totalIDA blendIDA onlyIDA totalIndiaIndonesiaIran, Islamic Rep.IraqIrelandIsraelItalyJamaicaJapanJordanKazakhstanKenyaKiribatiKorea, Rep.KosovoKuwaitKyrgyz RepublicLao PDRLate-demographic dividendLatin America & Caribbean Latin America & Caribbean (excluding high income)Latin America & the Caribbean (IDA & IBRD countries)LatviaLeast developed countries: UN classificationLebanonLesothoLiberiaLibyaLithuaniaLow & middle incomeLow incomeLower middle incomeLuxembourgMacao SAR, ChinaMacedonia, FYRMadagascarMalawiMalaysiaMaldivesMaliMaltaMarshall IslandsMauritaniaMauritiusMexicoMicronesia, Fed. Sts.Middle East & North Africa (excluding high income)Middle East & North Africa (IDA & IBRD countries)Middle incomeMoldovaMongoliaMontenegroMoroccoMozambiqueMyanmarNamibiaNepalNetherlandsNew CaledoniaNew ZealandNicaraguaNigerNigeriaNorth AmericaNorwayOECD membersOmanOther small statesPacific island small statesPakistanPalauPanamaPapua New GuineaParaguayPeruPhilippinesPolandPortugalPost-demographic dividendPre-demographic dividendQatarRomaniaRussian FederationRwandaSamoaSao Tome and PrincipeSaudi ArabiaSenegalSerbiaSeychellesSierra LeoneSingaporeSint Maarten (Dutch part)Slovak RepublicSloveniaSmall statesSolomon IslandsSouth AfricaSouth AsiaSouth Asia (IDA & IBRD)South SudanSpainSri LankaSt. Kitts and NevisSt. LuciaSt. Vincent and the GrenadinesSub-Saharan Africa Sub-Saharan Africa (excluding high income)Sub-Saharan Africa (IDA & IBRD countries)SudanSurinameSwazilandSwedenSwitzerlandSyrian Arab RepublicTajikistanTanzaniaThailandTimor-LesteTogoTongaTrinidad and TobagoTunisiaTurkeyTuvaluUgandaUkraineUnited KingdomUnited StatesUpper middle incomeUruguayVanuatuVenezuela, RBVietnamWest Bank and GazaWorldYemen, Rep.ZambiaZimbabwe La ligne de temps
Cette échelle de temps montre un graphique de 1987 année à 2016 année Aruba. Les données jusqu'à 1986 année ne sont pas présentés. Quantité d'observations actuelles selon dates: 30.
Source (désignation):
Les indicateurs du développement mondiale
Source (organisation):
International Monetary Fund, Balance of Payments Statistics Yearbook and data files.
Catégories:
Economy & Growth, Trade
Dernière mise à jour
23 avr. 2017
Les indicateurs de changement de valeurs selon les années
Minimum:
210.447 mln.
1 janv. 1987
Maximum:
6.018 mds
1 janv. 2009
Pour la date d''observation
Valeur
Changement absolu
Le changement par rapport à la valeur précédente
1 janv. 1987
210.447 mln.
+210.447 mln.
0.0%
1 janv. 1988
249.832 mln.
+39.385 mln.
18.72%
1 janv. 1989
354.637 mln.
+104.804 mln.
41.95%
1 janv. 1990
397.43 mln.
+42.793 mln.
12.07%
1 janv. 1991
580.838 mln.
+183.408 mln.
46.15%
1 janv. 1992
1.403 mds
+822.011 mln.
141.52%
1 janv. 1993
1.447 mds
+43.855 mln.
3.13%
1 janv. 1994
1.546 mds
+99.777 mln.
6.9%
1 janv. 1995
1.607 mds
+60.838 mln.
3.93%
1 janv. 1996
926.927 mln.
-680.391 mln.
-42.33%
1 janv. 1997
768.827 mln.
-158.101 mln.
-17.06%
1 janv. 1998
836.816 mln.
+67.989 mln.
8.84%
1 janv. 1999
966.704 mln.
+129.888 mln.
15.52%
1 janv. 2000
923.05 mln.
-43.654 mln.
-4.52%
1 janv. 2001
858.039 mln.
-65.011 mln.
-7.04%
1 janv. 2002
974.615 mln.
+116.575 mln.
13.59%
1 janv. 2003
974.056 mln.
-558.659 milles
-0.06%
1 janv. 2004
1.063 mds
+89.056 mln.
9.14%
1 janv. 2005
3.589 mds
+2.526 mds
237.6%
1 janv. 2006
4.296 mds
+707.194 mln.
19.7%
1 janv. 2007
4.724 mds
+428.102 mln.
9.96%
1 janv. 2008
5.126 mds
+401.692 mln.
8.5%
1 janv. 2009
6.018 mds
+891.955 mln.
17.4%
1 janv. 2010
2.453 mds
-3.565 mds
-59.24%
1 janv. 2011
1.394 mds
-1.059 mds
-43.17%
1 janv. 2012
5.917 mds
+4.523 mds
324.37%
1 janv. 2013
2.045 mds
-3.872 mds
-65.44%
1 janv. 2014
1.377 mds
-668.268 mln.
-32.68%
1 janv. 2015
1.351 mds
-25.698 mln.
-1.87%
1 janv. 2016
1.254 mds
-97.318 mln.
-7.2%
Classement des pays selon les statistiques actuelles par années


Commentaires: