29
/fr/
fr
AIzaSyAYiBZKx7MnpbEhh9jyipgxe19OcubqV5w
April 1, 2024
86965
Bolivia
BOL
true
2
1
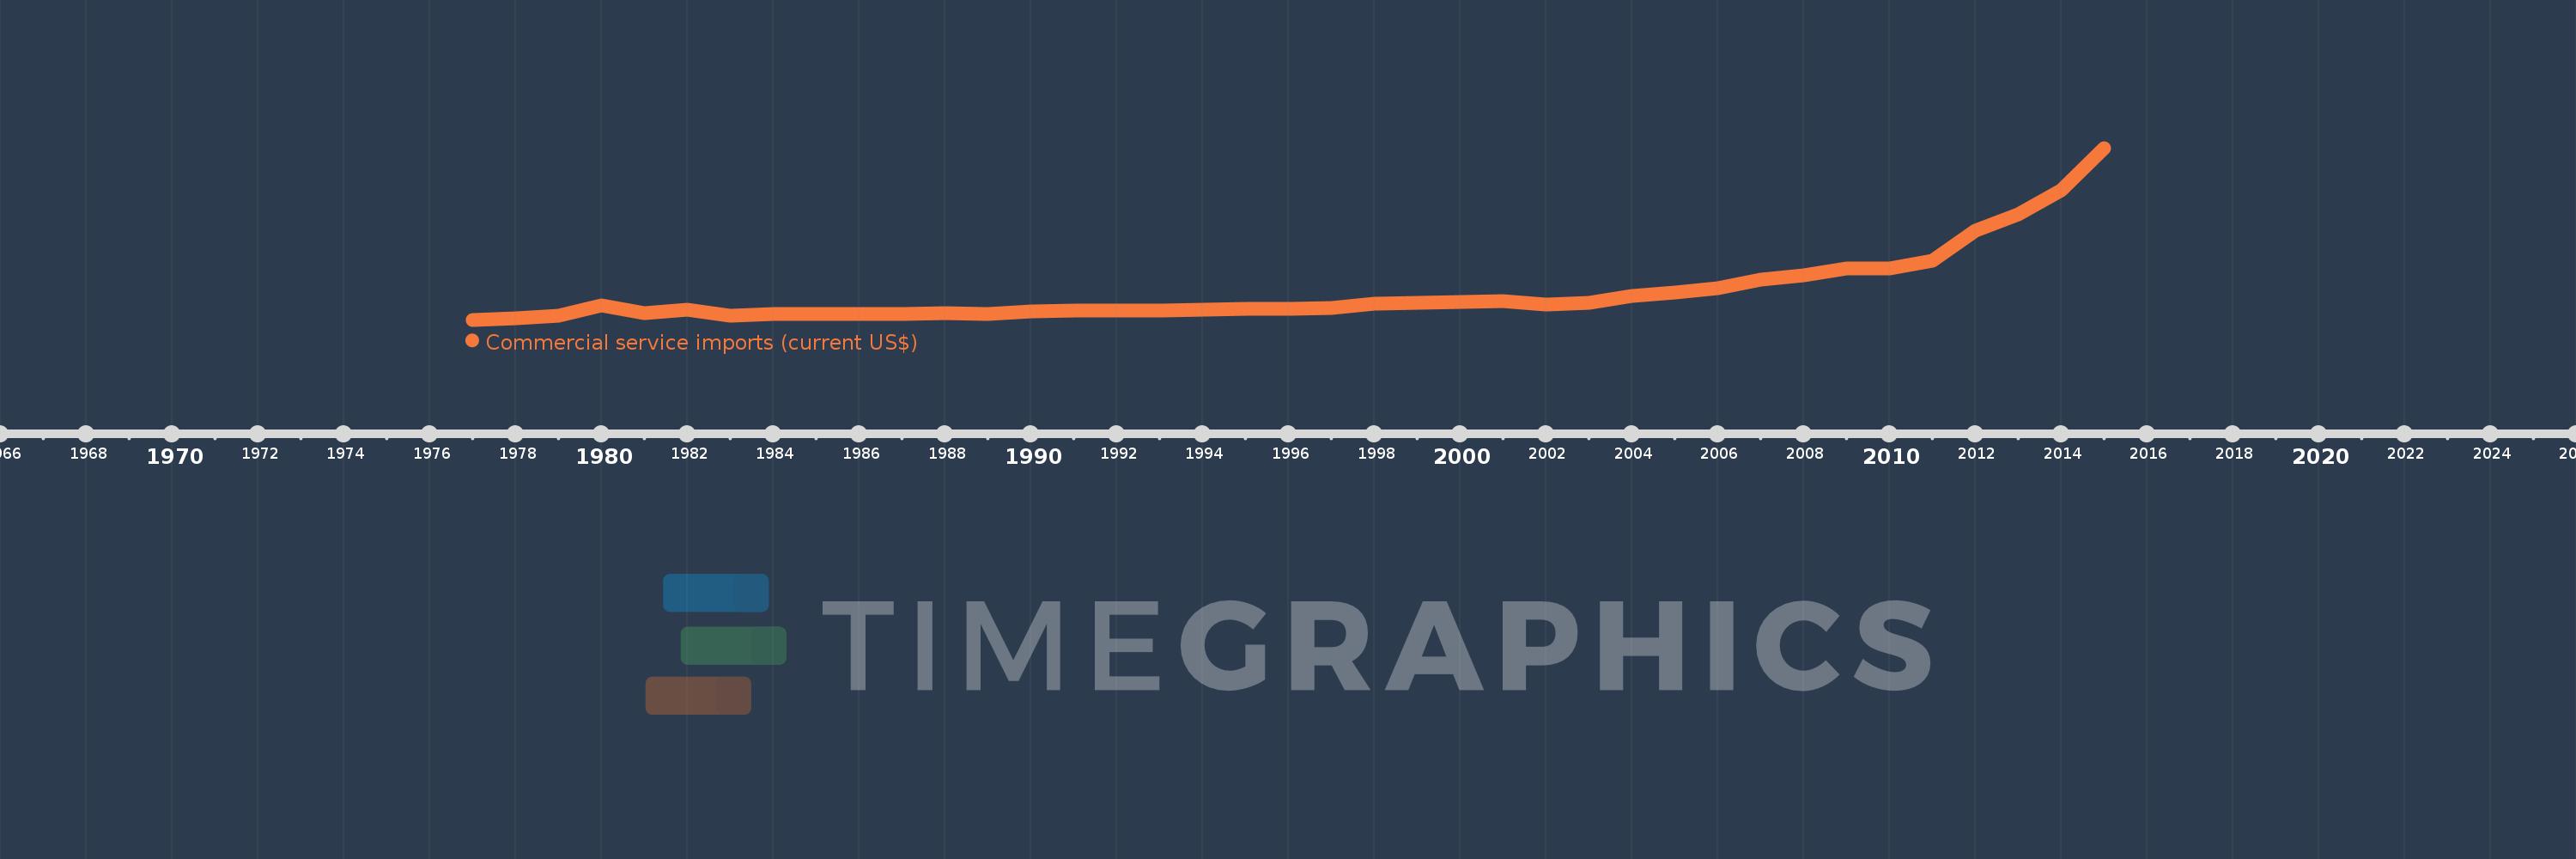
Commercial service imports (current US$)
2015,2014,2013,2012,2011,2010,2009,2008,2007,2006,2005,2004,2003,2002,2001,2000,1999,1998,1997,1996,1995,1994,1993,1992,1991,1990,1989,1988,1987,1986,1985,1984,1983,1982,1981,1980,1979,1978,1977
Cette statistique dans les autres pays:
AfghanistanAlbaniaAlgeriaAngolaAntigua and BarbudaArab WorldArgentinaArmeniaArubaAustraliaAustriaAzerbaijanBahamas, TheBahrainBangladeshBarbadosBelarusBelgiumBelizeBeninBermudaBhutanBoliviaBosnia and HerzegovinaBotswanaBrazilBrunei DarussalamBulgariaBurkina FasoBurundiCabo VerdeCambodiaCameroonCanadaCaribbean small statesCentral African RepublicCentral Europe and the BalticsChadChileChinaColombiaComorosCongo, Dem. Rep.Congo, Rep.Costa RicaCote d'IvoireCroatiaCuracaoCyprusCzech RepublicDenmarkDjiboutiDominicaDominican RepublicEarly-demographic dividendEast Asia & PacificEast Asia & Pacific (excluding high income)East Asia & Pacific (IDA & IBRD countries)EcuadorEgypt, Arab Rep.El SalvadorEquatorial GuineaEritreaEstoniaEthiopiaEuro areaEurope & Central AsiaEurope & Central Asia (excluding high income)Europe & Central Asia (IDA & IBRD countries)European UnionFaroe IslandsFijiFinlandFragile and conflict affected situationsFranceFrench PolynesiaGabonGambia, TheGeorgiaGermanyGhanaGreeceGrenadaGuatemalaGuineaGuinea-BissauGuyanaHaitiHeavily indebted poor countries (HIPC)High incomeHondurasHong Kong SAR, ChinaHungaryIBRD onlyIcelandIDA & IBRD totalIDA blendIDA onlyIDA totalIndiaIndonesiaIran, Islamic Rep.IraqIrelandIsraelItalyJamaicaJapanJordanKazakhstanKenyaKiribatiKorea, Rep.KosovoKuwaitKyrgyz RepublicLao PDRLate-demographic dividendLatin America & Caribbean Latin America & Caribbean (excluding high income)Latin America & the Caribbean (IDA & IBRD countries)LatviaLeast developed countries: UN classificationLebanonLesothoLiberiaLibyaLithuaniaLow & middle incomeLow incomeLower middle incomeLuxembourgMacao SAR, ChinaMacedonia, FYRMadagascarMalawiMalaysiaMaldivesMaliMaltaMarshall IslandsMauritaniaMauritiusMexicoMicronesia, Fed. Sts.Middle East & North Africa (excluding high income)Middle East & North Africa (IDA & IBRD countries)Middle incomeMoldovaMongoliaMontenegroMoroccoMozambiqueMyanmarNamibiaNepalNetherlandsNew CaledoniaNew ZealandNicaraguaNigerNigeriaNorth AmericaNorwayOECD membersOmanOther small statesPacific island small statesPakistanPalauPanamaPapua New GuineaParaguayPeruPhilippinesPolandPortugalPost-demographic dividendPre-demographic dividendQatarRomaniaRussian FederationRwandaSamoaSao Tome and PrincipeSaudi ArabiaSenegalSerbiaSeychellesSierra LeoneSingaporeSint Maarten (Dutch part)Slovak RepublicSloveniaSmall statesSolomon IslandsSouth AfricaSouth AsiaSouth Asia (IDA & IBRD)South SudanSpainSri LankaSt. Kitts and NevisSt. LuciaSt. Vincent and the GrenadinesSub-Saharan Africa Sub-Saharan Africa (excluding high income)Sub-Saharan Africa (IDA & IBRD countries)SudanSurinameSwazilandSwedenSwitzerlandSyrian Arab RepublicTajikistanTanzaniaThailandTimor-LesteTogoTongaTrinidad and TobagoTunisiaTurkeyTuvaluUgandaUkraineUnited KingdomUnited StatesUpper middle incomeUruguayVanuatuVenezuela, RBVietnamWest Bank and GazaWorldYemen, Rep.ZambiaZimbabwe La ligne de temps
Cette échelle de temps montre un graphique de 1977 année à 2015 année Bolivia. Les données jusqu'à 1976 année ne sont pas présentés. Quantité d'observations actuelles selon dates: 39.
Source (désignation):
Les indicateurs du développement mondiale
Source (organisation):
International Monetary Fund, Balance of Payments Statistics Yearbook and data files.
Catégories:
Private Sector, Trade
Dernière mise à jour
23 avr. 2017
Les indicateurs de changement de valeurs selon les années
Minimum:
133.8 mln.
1 janv. 1977
Maximum:
3.007 mds
1 janv. 2015
Pour la date d''observation
Valeur
Changement absolu
Le changement par rapport à la valeur précédente
1 janv. 1977
133.8 mln.
+133.8 mln.
0.0%
1 janv. 1978
162.9 mln.
+29.1 mln.
21.75%
1 janv. 1979
205.2 mln.
+42.3 mln.
25.97%
1 janv. 1980
373.2 mln.
+168.0 mln.
81.87%
1 janv. 1981
237.7 mln.
-135.5 mln.
-36.31%
1 janv. 1982
299.3 mln.
+61.6 mln.
25.92%
1 janv. 1983
202.2 mln.
-97.1 mln.
-32.44%
1 janv. 1984
229.0 mln.
+26.8 mln.
13.25%
1 janv. 1985
231.9 mln.
+2.9 mln.
1.27%
1 janv. 1986
224.5 mln.
-7.4 mln.
-3.19%
1 janv. 1987
222.9 mln.
-1.6 mln.
-0.71%
1 janv. 1988
249.3 mln.
+26.4 mln.
11.84%
1 janv. 1989
235.2 mln.
-14.1 mln.
-5.66%
1 janv. 1990
279.5 mln.
+44.3 mln.
18.84%
1 janv. 1991
290.6 mln.
+11.1 mln.
3.97%
1 janv. 1992
290.5 mln.
-100.0 milles
-0.03%
1 janv. 1993
289.9 mln.
-600.0 milles
-0.21%
1 janv. 1994
298.6 mln.
+8.7 mln.
3.0%
1 janv. 1995
314.3 mln.
+15.7 mln.
5.26%
1 janv. 1996
320.7 mln.
+6.4 mln.
2.04%
1 janv. 1997
336.75 mln.
+16.05 mln.
5.0%
1 janv. 1998
400.64 mln.
+63.89 mln.
18.97%
1 janv. 1999
422.5 mln.
+21.86 mln.
5.46%
1 janv. 2000
435.5 mln.
+13.0 mln.
3.08%
1 janv. 2001
450.48 mln.
+14.98 mln.
3.44%
1 janv. 2002
382.444 mln.
-68.036 mln.
-15.1%
1 janv. 2003
417.395 mln.
+34.951 mln.
9.14%
1 janv. 2004
533.54 mln.
+116.145 mln.
27.83%
1 janv. 2005
589.065 mln.
+55.525 mln.
10.41%
1 janv. 2006
663.229 mln.
+74.164 mln.
12.59%
1 janv. 2007
806.516 mln.
+143.287 mln.
21.6%
1 janv. 2008
880.158 mln.
+73.641 mln.
9.13%
1 janv. 2009
992.708 mln.
+112.55 mln.
12.79%
1 janv. 2010
989.85 mln.
-2.858 mln.
-0.29%
1 janv. 2011
1.125 mds
+135.165 mln.
13.66%
1 janv. 2012
1.625 mds
+500.221 mln.
44.46%
1 janv. 2013
1.895 mds
+270.079 mln.
16.62%
1 janv. 2014
2.302 mds
+406.478 mln.
21.45%
1 janv. 2015
3.007 mds
+704.911 mln.
30.62%
Classement des pays selon les statistiques actuelles par années


Commentaires: