29
/fr/
fr
AIzaSyAYiBZKx7MnpbEhh9jyipgxe19OcubqV5w
April 1, 2024
285651
Zambia
ZMB
true
2
1
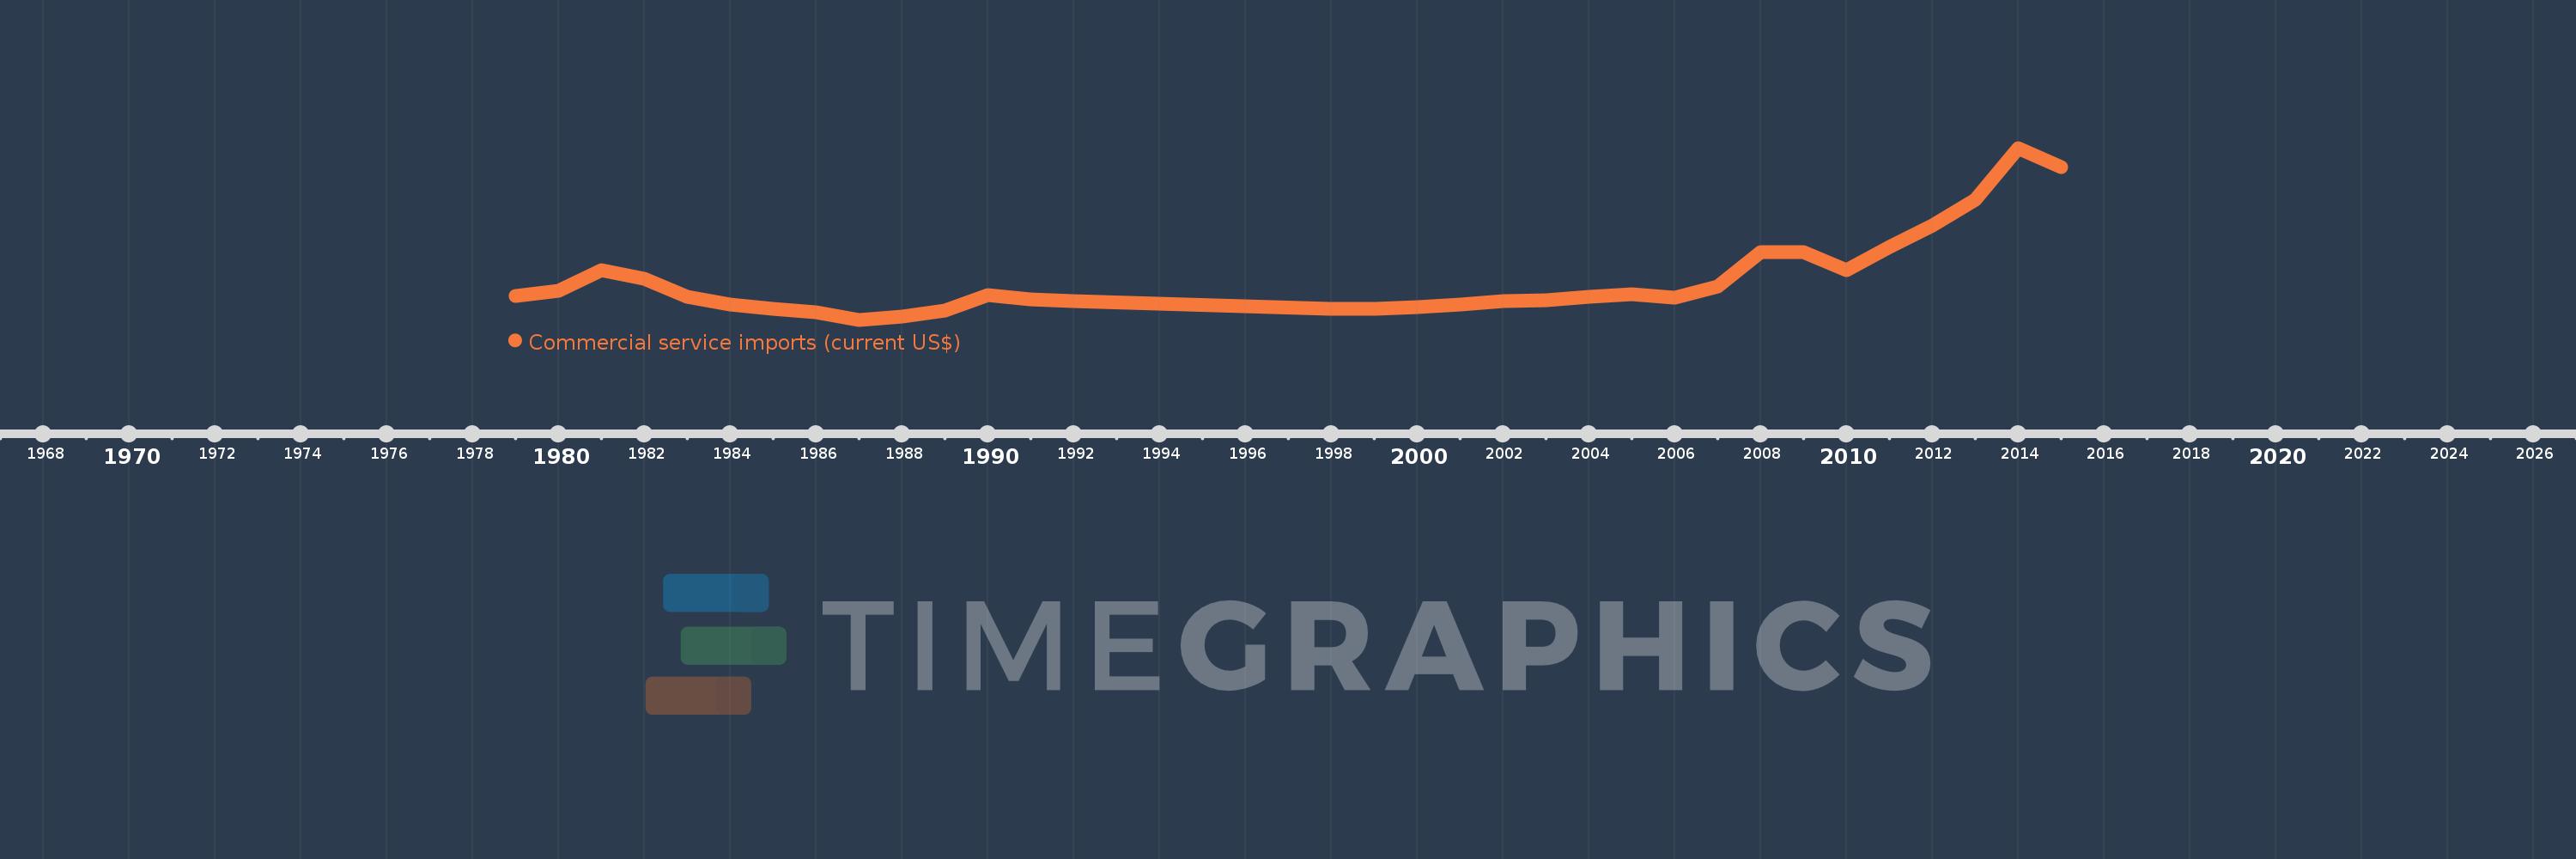
Commercial service imports (current US$)
2015,2014,2013,2012,2011,2010,2009,2008,2007,2006,2005,2004,2003,2002,2001,2000,1999,1998,1992,1991,1990,1989,1988,1987,1986,1985,1984,1983,1982,1981,1980,1979
Cette statistique dans les autres pays:
AfghanistanAlbaniaAlgeriaAngolaAntigua and BarbudaArab WorldArgentinaArmeniaArubaAustraliaAustriaAzerbaijanBahamas, TheBahrainBangladeshBarbadosBelarusBelgiumBelizeBeninBermudaBhutanBoliviaBosnia and HerzegovinaBotswanaBrazilBrunei DarussalamBulgariaBurkina FasoBurundiCabo VerdeCambodiaCameroonCanadaCaribbean small statesCentral African RepublicCentral Europe and the BalticsChadChileChinaColombiaComorosCongo, Dem. Rep.Congo, Rep.Costa RicaCote d'IvoireCroatiaCuracaoCyprusCzech RepublicDenmarkDjiboutiDominicaDominican RepublicEarly-demographic dividendEast Asia & PacificEast Asia & Pacific (excluding high income)East Asia & Pacific (IDA & IBRD countries)EcuadorEgypt, Arab Rep.El SalvadorEquatorial GuineaEritreaEstoniaEthiopiaEuro areaEurope & Central AsiaEurope & Central Asia (excluding high income)Europe & Central Asia (IDA & IBRD countries)European UnionFaroe IslandsFijiFinlandFragile and conflict affected situationsFranceFrench PolynesiaGabonGambia, TheGeorgiaGermanyGhanaGreeceGrenadaGuatemalaGuineaGuinea-BissauGuyanaHaitiHeavily indebted poor countries (HIPC)High incomeHondurasHong Kong SAR, ChinaHungaryIBRD onlyIcelandIDA & IBRD totalIDA blendIDA onlyIDA totalIndiaIndonesiaIran, Islamic Rep.IraqIrelandIsraelItalyJamaicaJapanJordanKazakhstanKenyaKiribatiKorea, Rep.KosovoKuwaitKyrgyz RepublicLao PDRLate-demographic dividendLatin America & Caribbean Latin America & Caribbean (excluding high income)Latin America & the Caribbean (IDA & IBRD countries)LatviaLeast developed countries: UN classificationLebanonLesothoLiberiaLibyaLithuaniaLow & middle incomeLow incomeLower middle incomeLuxembourgMacao SAR, ChinaMacedonia, FYRMadagascarMalawiMalaysiaMaldivesMaliMaltaMarshall IslandsMauritaniaMauritiusMexicoMicronesia, Fed. Sts.Middle East & North Africa (excluding high income)Middle East & North Africa (IDA & IBRD countries)Middle incomeMoldovaMongoliaMontenegroMoroccoMozambiqueMyanmarNamibiaNepalNetherlandsNew CaledoniaNew ZealandNicaraguaNigerNigeriaNorth AmericaNorwayOECD membersOmanOther small statesPacific island small statesPakistanPalauPanamaPapua New GuineaParaguayPeruPhilippinesPolandPortugalPost-demographic dividendPre-demographic dividendQatarRomaniaRussian FederationRwandaSamoaSao Tome and PrincipeSaudi ArabiaSenegalSerbiaSeychellesSierra LeoneSingaporeSint Maarten (Dutch part)Slovak RepublicSloveniaSmall statesSolomon IslandsSouth AfricaSouth AsiaSouth Asia (IDA & IBRD)South SudanSpainSri LankaSt. Kitts and NevisSt. LuciaSt. Vincent and the GrenadinesSub-Saharan Africa Sub-Saharan Africa (excluding high income)Sub-Saharan Africa (IDA & IBRD countries)SudanSurinameSwazilandSwedenSwitzerlandSyrian Arab RepublicTajikistanTanzaniaThailandTimor-LesteTogoTongaTrinidad and TobagoTunisiaTurkeyTuvaluUgandaUkraineUnited KingdomUnited StatesUpper middle incomeUruguayVanuatuVenezuela, RBVietnamWest Bank and GazaWorldYemen, Rep.ZambiaZimbabwe La ligne de temps
Cette échelle de temps montre un graphique de 1979 année à 2015 année Zambia. Les données jusqu'à 1978 année ne sont pas présentés. Quantité d'observations actuelles selon dates: 32.
Source (désignation):
Les indicateurs du développement mondiale
Source (organisation):
International Monetary Fund, Balance of Payments Statistics Yearbook and data files.
Catégories:
Private Sector, Trade
Dernière mise à jour
23 avr. 2017
Les indicateurs de changement de valeurs selon les années
Minimum:
179.2 mln.
1 janv. 1987
Maximum:
1.77 mds
1 janv. 2014
Pour la date d''observation
Valeur
Changement absolu
Le changement par rapport à la valeur précédente
1 janv. 1979
397.7 mln.
+397.7 mln.
0.0%
1 janv. 1980
444.7 mln.
+47.0 mln.
11.82%
1 janv. 1981
638.4 mln.
+193.7 mln.
43.56%
1 janv. 1982
562.3 mln.
-76.1 mln.
-11.92%
1 janv. 1983
389.4 mln.
-172.9 mln.
-30.75%
1 janv. 1984
320.8 mln.
-68.6 mln.
-17.62%
1 janv. 1985
280.7 mln.
-40.1 mln.
-12.5%
1 janv. 1986
249.2 mln.
-31.5 mln.
-11.22%
1 janv. 1987
179.2 mln.
-70.0 mln.
-28.09%
1 janv. 1988
207.4 mln.
+28.2 mln.
15.74%
1 janv. 1989
260.4 mln.
+53.0 mln.
25.55%
1 janv. 1990
408.1 mln.
+147.7 mln.
56.72%
1 janv. 1991
370.1 mln.
-38.0 mln.
-9.31%
1 janv. 1992
352.3 mln.
-17.8 mln.
-4.81%
1 janv. 1998
281.7 mln.
-70.6 mln.
-20.04%
1 janv. 1999
278.0 mln.
-3.7 mln.
-1.31%
1 janv. 2000
297.6 mln.
+19.6 mln.
7.05%
1 janv. 2001
322.327 mln.
+24.727 mln.
8.31%
1 janv. 2002
353.127 mln.
+30.8 mln.
9.56%
1 janv. 2003
360.6 mln.
+7.473 mln.
2.12%
1 janv. 2004
387.8 mln.
+27.2 mln.
7.54%
1 janv. 2005
417.8 mln.
+30.0 mln.
7.74%
1 janv. 2006
387.125 mln.
-30.675 mln.
-7.34%
1 janv. 2007
487.541 mln.
+100.416 mln.
25.94%
1 janv. 2008
806.904 mln.
+319.363 mln.
65.51%
1 janv. 2009
804.951 mln.
-1.953 mln.
-0.24%
1 janv. 2010
640.203 mln.
-164.748 mln.
-20.47%
1 janv. 2011
849.416 mln.
+209.213 mln.
32.68%
1 janv. 2012
1.052 mds
+202.586 mln.
23.85%
1 janv. 2013
1.29 mds
+238.464 mln.
22.67%
1 janv. 2014
1.77 mds
+479.684 mln.
37.17%
1 janv. 2015
1.596 mds
-174.614 mln.
-9.86%
Classement des pays selon les statistiques actuelles par années


Commentaires: