29
/fr/
fr
AIzaSyAYiBZKx7MnpbEhh9jyipgxe19OcubqV5w
April 1, 2024
64447
Albania
ALB
true
2
1
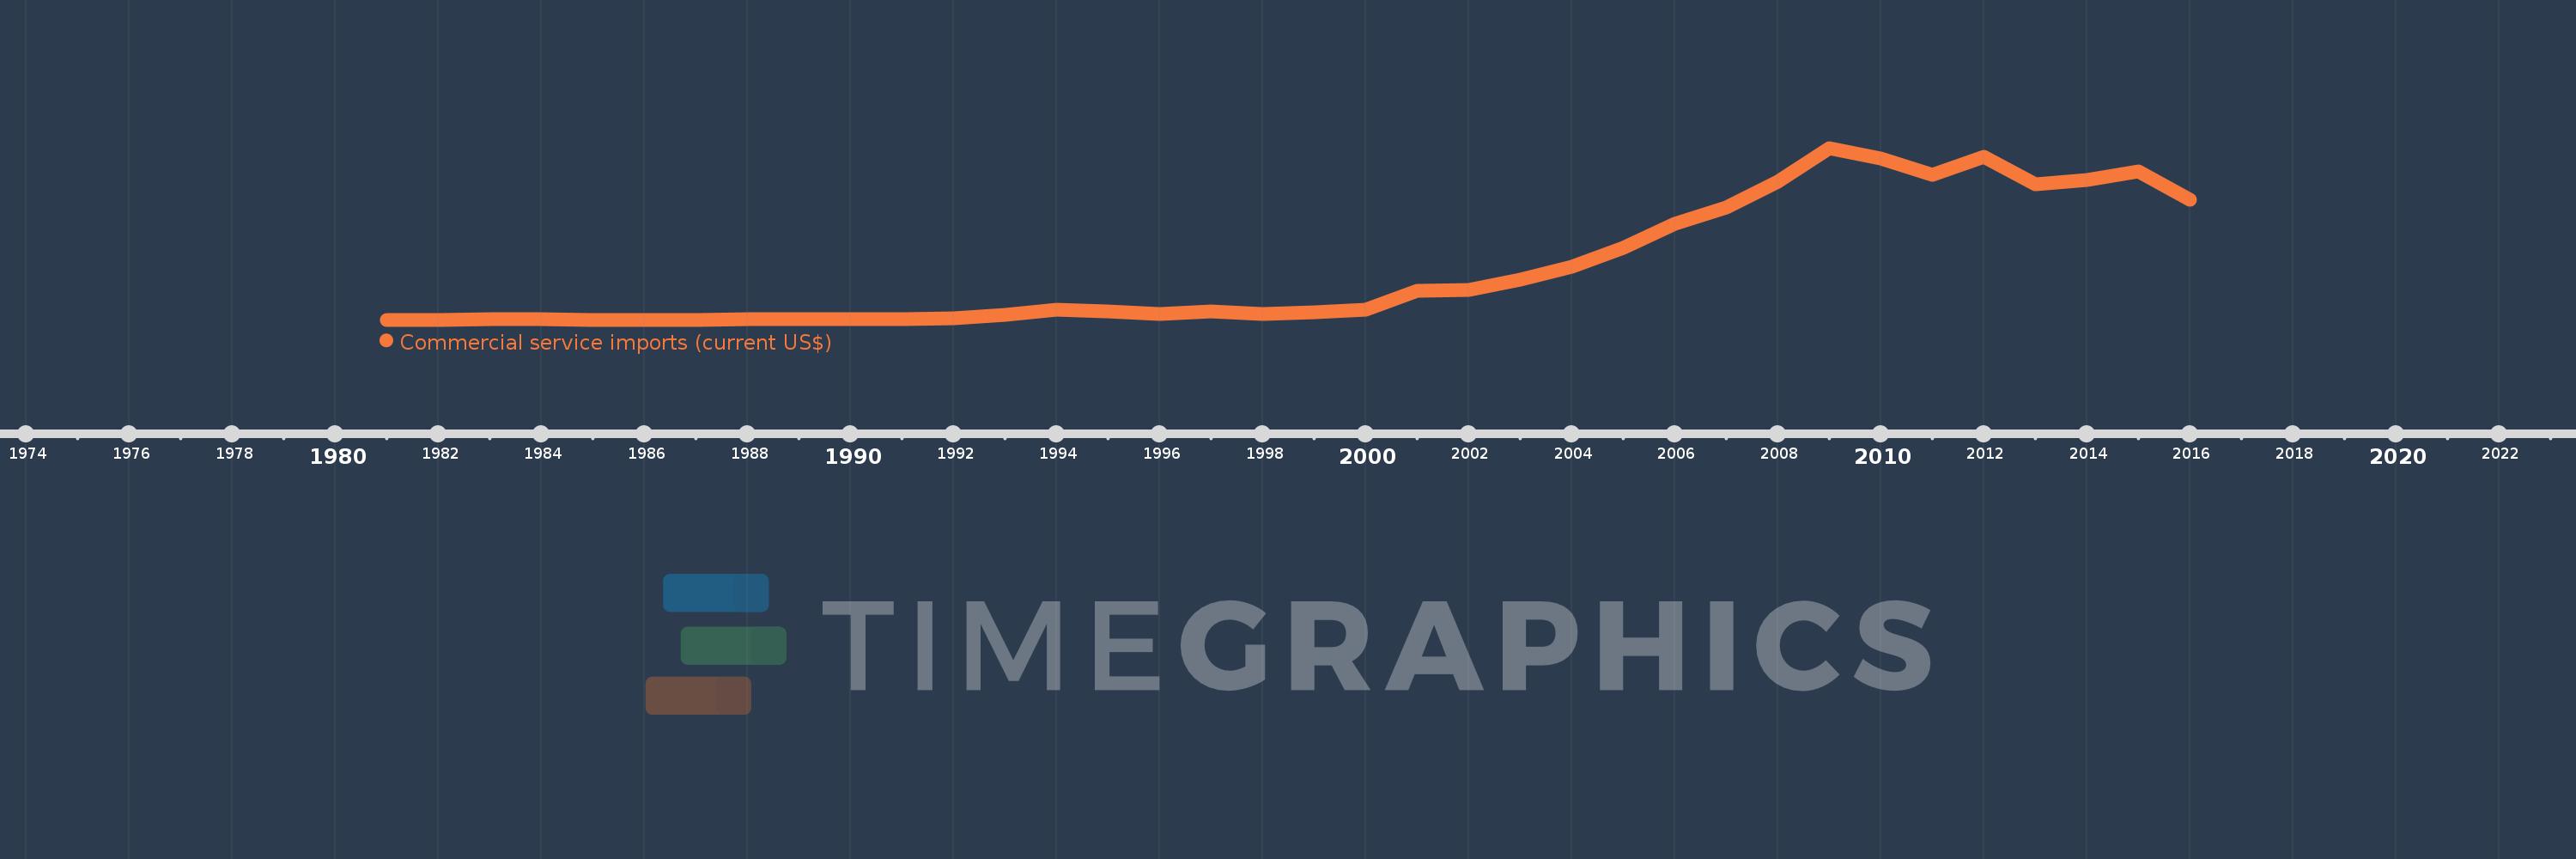
Commercial service imports (current US$)
2016,2015,2014,2013,2012,2011,2010,2009,2008,2007,2006,2005,2004,2003,2002,2001,2000,1999,1998,1997,1996,1995,1994,1993,1992,1991,1990,1989,1988,1987,1986,1985,1984,1983,1982,1981
Cette statistique dans les autres pays:
AfghanistanAlbaniaAlgeriaAngolaAntigua and BarbudaArab WorldArgentinaArmeniaArubaAustraliaAustriaAzerbaijanBahamas, TheBahrainBangladeshBarbadosBelarusBelgiumBelizeBeninBermudaBhutanBoliviaBosnia and HerzegovinaBotswanaBrazilBrunei DarussalamBulgariaBurkina FasoBurundiCabo VerdeCambodiaCameroonCanadaCaribbean small statesCentral African RepublicCentral Europe and the BalticsChadChileChinaColombiaComorosCongo, Dem. Rep.Congo, Rep.Costa RicaCote d'IvoireCroatiaCuracaoCyprusCzech RepublicDenmarkDjiboutiDominicaDominican RepublicEarly-demographic dividendEast Asia & PacificEast Asia & Pacific (excluding high income)East Asia & Pacific (IDA & IBRD countries)EcuadorEgypt, Arab Rep.El SalvadorEquatorial GuineaEritreaEstoniaEthiopiaEuro areaEurope & Central AsiaEurope & Central Asia (excluding high income)Europe & Central Asia (IDA & IBRD countries)European UnionFaroe IslandsFijiFinlandFragile and conflict affected situationsFranceFrench PolynesiaGabonGambia, TheGeorgiaGermanyGhanaGreeceGrenadaGuatemalaGuineaGuinea-BissauGuyanaHaitiHeavily indebted poor countries (HIPC)High incomeHondurasHong Kong SAR, ChinaHungaryIBRD onlyIcelandIDA & IBRD totalIDA blendIDA onlyIDA totalIndiaIndonesiaIran, Islamic Rep.IraqIrelandIsraelItalyJamaicaJapanJordanKazakhstanKenyaKiribatiKorea, Rep.KosovoKuwaitKyrgyz RepublicLao PDRLate-demographic dividendLatin America & Caribbean Latin America & Caribbean (excluding high income)Latin America & the Caribbean (IDA & IBRD countries)LatviaLeast developed countries: UN classificationLebanonLesothoLiberiaLibyaLithuaniaLow & middle incomeLow incomeLower middle incomeLuxembourgMacao SAR, ChinaMacedonia, FYRMadagascarMalawiMalaysiaMaldivesMaliMaltaMarshall IslandsMauritaniaMauritiusMexicoMicronesia, Fed. Sts.Middle East & North Africa (excluding high income)Middle East & North Africa (IDA & IBRD countries)Middle incomeMoldovaMongoliaMontenegroMoroccoMozambiqueMyanmarNamibiaNepalNetherlandsNew CaledoniaNew ZealandNicaraguaNigerNigeriaNorth AmericaNorwayOECD membersOmanOther small statesPacific island small statesPakistanPalauPanamaPapua New GuineaParaguayPeruPhilippinesPolandPortugalPost-demographic dividendPre-demographic dividendQatarRomaniaRussian FederationRwandaSamoaSao Tome and PrincipeSaudi ArabiaSenegalSerbiaSeychellesSierra LeoneSingaporeSint Maarten (Dutch part)Slovak RepublicSloveniaSmall statesSolomon IslandsSouth AfricaSouth AsiaSouth Asia (IDA & IBRD)South SudanSpainSri LankaSt. Kitts and NevisSt. LuciaSt. Vincent and the GrenadinesSub-Saharan Africa Sub-Saharan Africa (excluding high income)Sub-Saharan Africa (IDA & IBRD countries)SudanSurinameSwazilandSwedenSwitzerlandSyrian Arab RepublicTajikistanTanzaniaThailandTimor-LesteTogoTongaTrinidad and TobagoTunisiaTurkeyTuvaluUgandaUkraineUnited KingdomUnited StatesUpper middle incomeUruguayVanuatuVenezuela, RBVietnamWest Bank and GazaWorldYemen, Rep.ZambiaZimbabwe La ligne de temps
Cette échelle de temps montre un graphique de 1981 année à 2016 année Albania. Les données jusqu'à 1980 année ne sont pas présentés. Quantité d'observations actuelles selon dates: 36.
Source (désignation):
Les indicateurs du développement mondiale
Source (organisation):
International Monetary Fund, Balance of Payments Statistics Yearbook and data files.
Catégories:
Private Sector, Trade
Dernière mise à jour
23 avr. 2017
Les indicateurs de changement de valeurs selon les années
Minimum:
17.5 mln.
1 janv. 1981
Maximum:
2.354 mds
1 janv. 2009
Pour la date d''observation
Valeur
Changement absolu
Le changement par rapport à la valeur précédente
1 janv. 1981
17.5 mln.
+17.5 mln.
0.0%
1 janv. 1982
19.4 mln.
+1.9 mln.
10.86%
1 janv. 1983
22.1 mln.
+2.7 mln.
13.92%
1 janv. 1984
22.1 mln.
0.0
0.0%
1 janv. 1985
19.1 mln.
-3.0 mln.
-13.57%
1 janv. 1986
17.9 mln.
-1.2 mln.
-6.28%
1 janv. 1987
19.7 mln.
+1.8 mln.
10.06%
1 janv. 1988
20.0 mln.
+300.0 milles
1.52%
1 janv. 1989
26.2 mln.
+6.2 mln.
31.0%
1 janv. 1990
27.9 mln.
+1.7 mln.
6.49%
1 janv. 1991
29.1 mln.
+1.2 mln.
4.3%
1 janv. 1992
33.4 mln.
+4.3 mln.
14.78%
1 janv. 1993
86.6 mln.
+53.2 mln.
159.28%
1 janv. 1994
158.4 mln.
+71.8 mln.
82.91%
1 janv. 1995
128.2 mln.
-30.2 mln.
-19.07%
1 janv. 1996
98.2 mln.
-30.0 mln.
-23.4%
1 janv. 1997
134.3 mln.
+36.1 mln.
36.76%
1 janv. 1998
92.612 mln.
-41.688 mln.
-31.04%
1 janv. 1999
119.27 mln.
+26.657 mln.
28.78%
1 janv. 2000
152.1 mln.
+32.83 mln.
27.53%
1 janv. 2001
413.1 mln.
+261.0 mln.
171.6%
1 janv. 2002
421.7 mln.
+8.6 mln.
2.08%
1 janv. 2003
561.22 mln.
+139.52 mln.
33.09%
1 janv. 2004
734.047 mln.
+172.827 mln.
30.79%
1 janv. 2005
991.371 mln.
+257.324 mln.
35.06%
1 janv. 2006
1.318 mds
+326.332 mln.
32.92%
1 janv. 2007
1.541 mds
+223.064 mln.
16.93%
1 janv. 2008
1.892 mds
+351.05 mln.
22.78%
1 janv. 2009
2.354 mds
+462.028 mln.
24.42%
1 janv. 2010
2.216 mds
-137.992 mln.
-5.86%
1 janv. 2011
1.989 mds
-227.317 mln.
-10.26%
1 janv. 2012
2.235 mds
+246.89 mln.
12.42%
1 janv. 2013
1.861 mds
-374.854 mln.
-16.77%
1 janv. 2014
1.921 mds
+60.088 mln.
3.23%
1 janv. 2015
2.029 mds
+108.526 mln.
5.65%
1 janv. 2016
1.644 mds
-384.757 mln.
-18.96%
Classement des pays selon les statistiques actuelles par années


Commentaires: