29
/fr/
fr
AIzaSyAYiBZKx7MnpbEhh9jyipgxe19OcubqV5w
April 1, 2024
53975
Pacific island small states
PSS
false
2
1
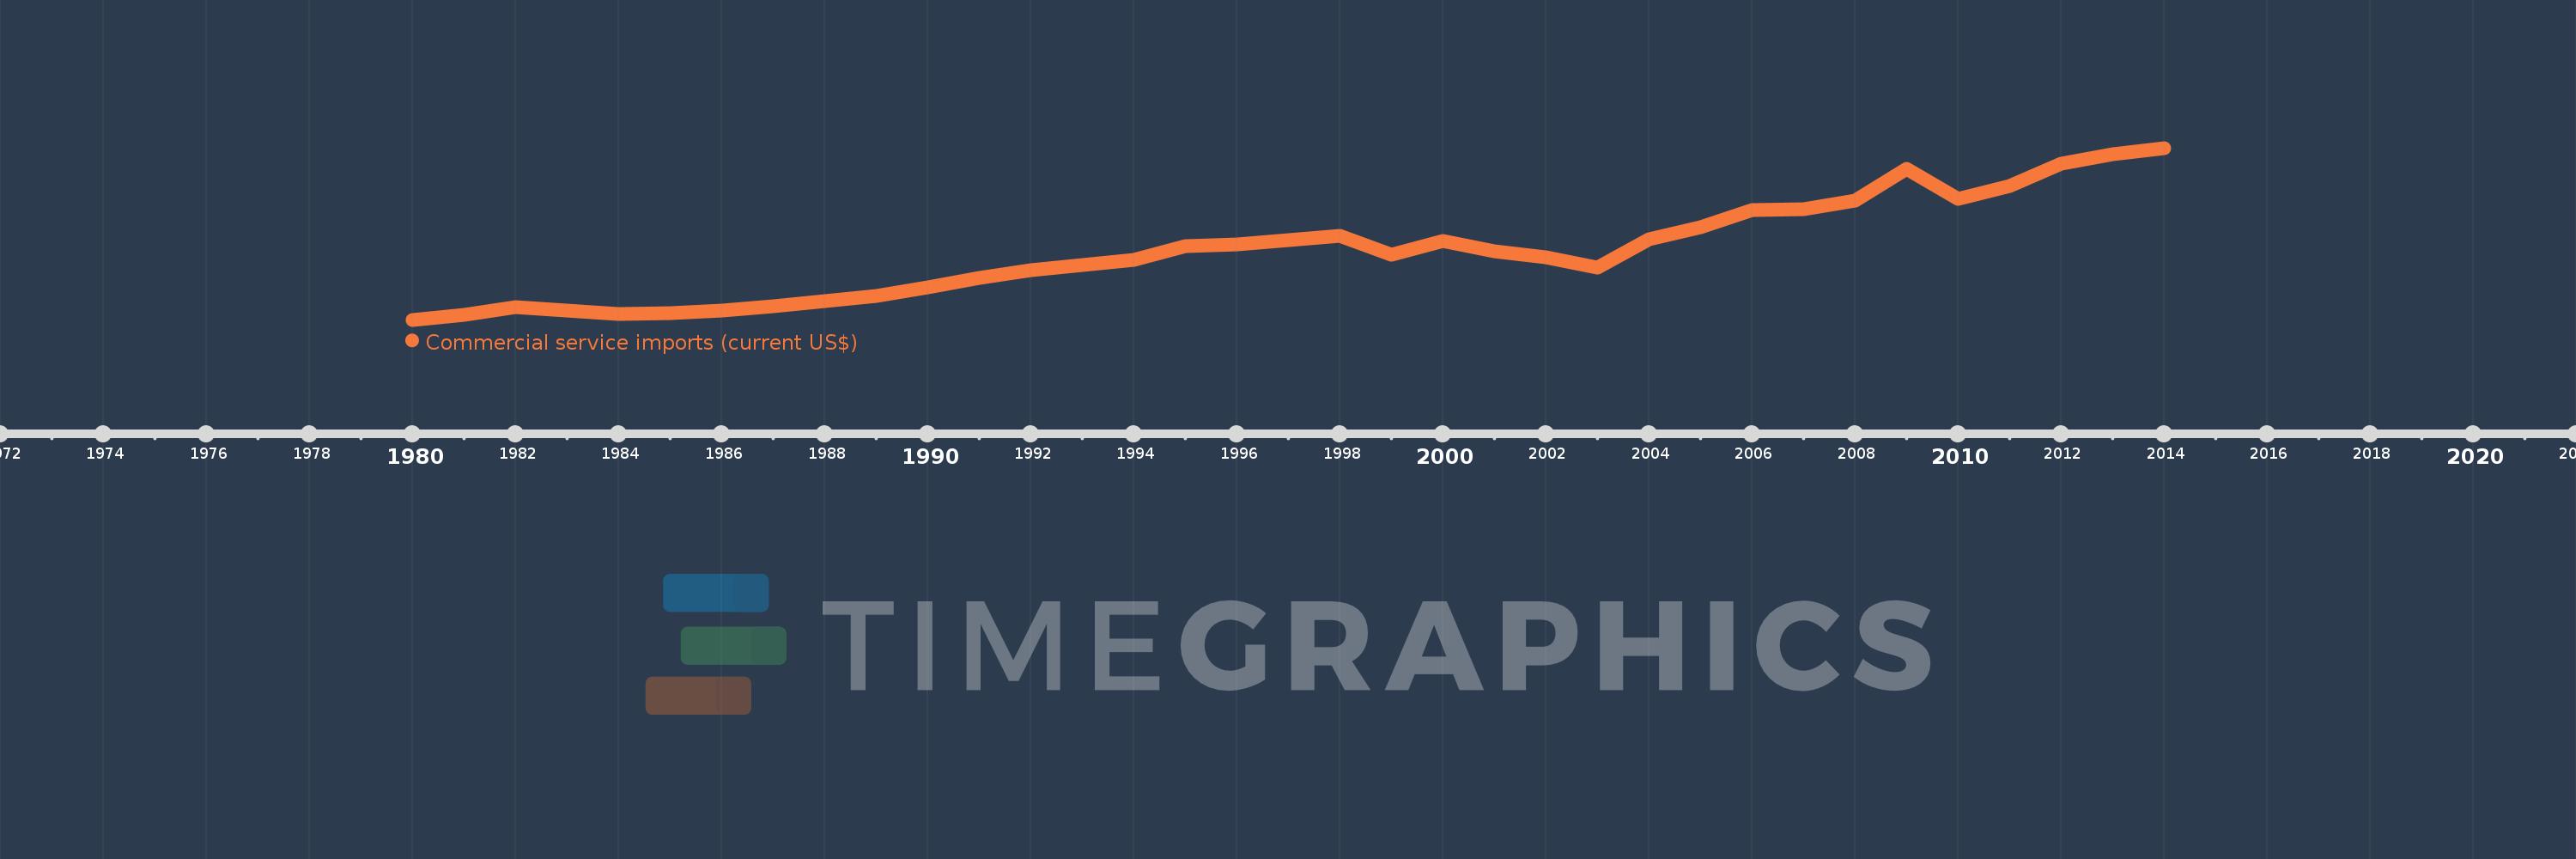
Commercial service imports (current US$)
2014,2013,2012,2011,2010,2009,2008,2007,2006,2005,2004,2003,2002,2001,2000,1999,1998,1997,1996,1995,1994,1993,1992,1991,1990,1989,1988,1987,1986,1985,1984,1983,1982,1981,1980
Cette statistique dans les autres pays:
AfghanistanAlbaniaAlgeriaAngolaAntigua and BarbudaArab WorldArgentinaArmeniaArubaAustraliaAustriaAzerbaijanBahamas, TheBahrainBangladeshBarbadosBelarusBelgiumBelizeBeninBermudaBhutanBoliviaBosnia and HerzegovinaBotswanaBrazilBrunei DarussalamBulgariaBurkina FasoBurundiCabo VerdeCambodiaCameroonCanadaCaribbean small statesCentral African RepublicCentral Europe and the BalticsChadChileChinaColombiaComorosCongo, Dem. Rep.Congo, Rep.Costa RicaCote d'IvoireCroatiaCuracaoCyprusCzech RepublicDenmarkDjiboutiDominicaDominican RepublicEarly-demographic dividendEast Asia & PacificEast Asia & Pacific (excluding high income)East Asia & Pacific (IDA & IBRD countries)EcuadorEgypt, Arab Rep.El SalvadorEquatorial GuineaEritreaEstoniaEthiopiaEuro areaEurope & Central AsiaEurope & Central Asia (excluding high income)Europe & Central Asia (IDA & IBRD countries)European UnionFaroe IslandsFijiFinlandFragile and conflict affected situationsFranceFrench PolynesiaGabonGambia, TheGeorgiaGermanyGhanaGreeceGrenadaGuatemalaGuineaGuinea-BissauGuyanaHaitiHeavily indebted poor countries (HIPC)High incomeHondurasHong Kong SAR, ChinaHungaryIBRD onlyIcelandIDA & IBRD totalIDA blendIDA onlyIDA totalIndiaIndonesiaIran, Islamic Rep.IraqIrelandIsraelItalyJamaicaJapanJordanKazakhstanKenyaKiribatiKorea, Rep.KosovoKuwaitKyrgyz RepublicLao PDRLate-demographic dividendLatin America & Caribbean Latin America & Caribbean (excluding high income)Latin America & the Caribbean (IDA & IBRD countries)LatviaLeast developed countries: UN classificationLebanonLesothoLiberiaLibyaLithuaniaLow & middle incomeLow incomeLower middle incomeLuxembourgMacao SAR, ChinaMacedonia, FYRMadagascarMalawiMalaysiaMaldivesMaliMaltaMarshall IslandsMauritaniaMauritiusMexicoMicronesia, Fed. Sts.Middle East & North Africa (excluding high income)Middle East & North Africa (IDA & IBRD countries)Middle incomeMoldovaMongoliaMontenegroMoroccoMozambiqueMyanmarNamibiaNepalNetherlandsNew CaledoniaNew ZealandNicaraguaNigerNigeriaNorth AmericaNorwayOECD membersOmanOther small statesPacific island small statesPakistanPalauPanamaPapua New GuineaParaguayPeruPhilippinesPolandPortugalPost-demographic dividendPre-demographic dividendQatarRomaniaRussian FederationRwandaSamoaSao Tome and PrincipeSaudi ArabiaSenegalSerbiaSeychellesSierra LeoneSingaporeSint Maarten (Dutch part)Slovak RepublicSloveniaSmall statesSolomon IslandsSouth AfricaSouth AsiaSouth Asia (IDA & IBRD)South SudanSpainSri LankaSt. Kitts and NevisSt. LuciaSt. Vincent and the GrenadinesSub-Saharan Africa Sub-Saharan Africa (excluding high income)Sub-Saharan Africa (IDA & IBRD countries)SudanSurinameSwazilandSwedenSwitzerlandSyrian Arab RepublicTajikistanTanzaniaThailandTimor-LesteTogoTongaTrinidad and TobagoTunisiaTurkeyTuvaluUgandaUkraineUnited KingdomUnited StatesUpper middle incomeUruguayVanuatuVenezuela, RBVietnamWest Bank and GazaWorldYemen, Rep.ZambiaZimbabwe La ligne de temps
Cette échelle de temps montre un graphique de 1980 année à 2014 année Pacific island small states. Les données jusqu'à 1979 année ne sont pas présentés. Quantité d'observations actuelles selon dates: 35.
Source (désignation):
Les indicateurs du développement mondiale
Source (organisation):
International Monetary Fund, Balance of Payments Statistics Yearbook and data files.
Catégories:
Private Sector, Trade
Dernière mise à jour
23 avr. 2017
Les indicateurs de changement de valeurs selon les années
Minimum:
197.321 mln.
1 janv. 1980
Maximum:
1.391 mds
1 janv. 2014
Pour la date d''observation
Valeur
Changement absolu
Le changement par rapport à la valeur précédente
1 janv. 1980
197.321 mln.
+197.321 mln.
0.0%
1 janv. 1981
234.241 mln.
+36.92 mln.
18.71%
1 janv. 1982
286.76 mln.
+52.519 mln.
22.42%
1 janv. 1983
259.225 mln.
-27.535 mln.
-9.6%
1 janv. 1984
240.264 mln.
-18.961 mln.
-7.31%
1 janv. 1985
245.211 mln.
+4.947 mln.
2.06%
1 janv. 1986
263.085 mln.
+17.873 mln.
7.29%
1 janv. 1987
288.247 mln.
+25.162 mln.
9.56%
1 janv. 1988
328.642 mln.
+40.395 mln.
14.01%
1 janv. 1989
365.168 mln.
+36.526 mln.
11.11%
1 janv. 1990
419.414 mln.
+54.247 mln.
14.86%
1 janv. 1991
490.611 mln.
+71.197 mln.
16.98%
1 janv. 1992
543.52 mln.
+52.91 mln.
10.78%
1 janv. 1993
575.386 mln.
+31.865 mln.
5.86%
1 janv. 1994
616.238 mln.
+40.853 mln.
7.1%
1 janv. 1995
710.849 mln.
+94.611 mln.
15.35%
1 janv. 1996
720.226 mln.
+9.377 mln.
1.32%
1 janv. 1997
749.129 mln.
+28.903 mln.
4.01%
1 janv. 1998
779.996 mln.
+30.867 mln.
4.12%
1 janv. 1999
651.379 mln.
-128.618 mln.
-16.49%
1 janv. 2000
747.431 mln.
+96.052 mln.
14.75%
1 janv. 2001
673.771 mln.
-73.66 mln.
-9.86%
1 janv. 2002
629.763 mln.
-44.008 mln.
-6.53%
1 janv. 2003
557.407 mln.
-72.356 mln.
-11.49%
1 janv. 2004
754.371 mln.
+196.963 mln.
35.34%
1 janv. 2005
838.404 mln.
+84.033 mln.
11.14%
1 janv. 2006
962.066 mln.
+123.662 mln.
14.75%
1 janv. 2007
966.277 mln.
+4.211 mln.
0.44%
1 janv. 2008
1.023 mds
+56.89 mln.
5.89%
1 janv. 2009
1.248 mds
+224.579 mln.
21.95%
1 janv. 2010
1.035 mds
-212.304 mln.
-17.02%
1 janv. 2011
1.129 mds
+94.008 mln.
9.08%
1 janv. 2012
1.282 mds
+152.512 mln.
13.5%
1 janv. 2013
1.345 mds
+62.74 mln.
4.89%
1 janv. 2014
1.391 mds
+46.297 mln.
3.44%
Classement des pays selon les statistiques actuelles par années


Commentaires: