29
/fr/
fr
AIzaSyAYiBZKx7MnpbEhh9jyipgxe19OcubqV5w
April 1, 2024
269088
Turkey
TUR
true
2
1
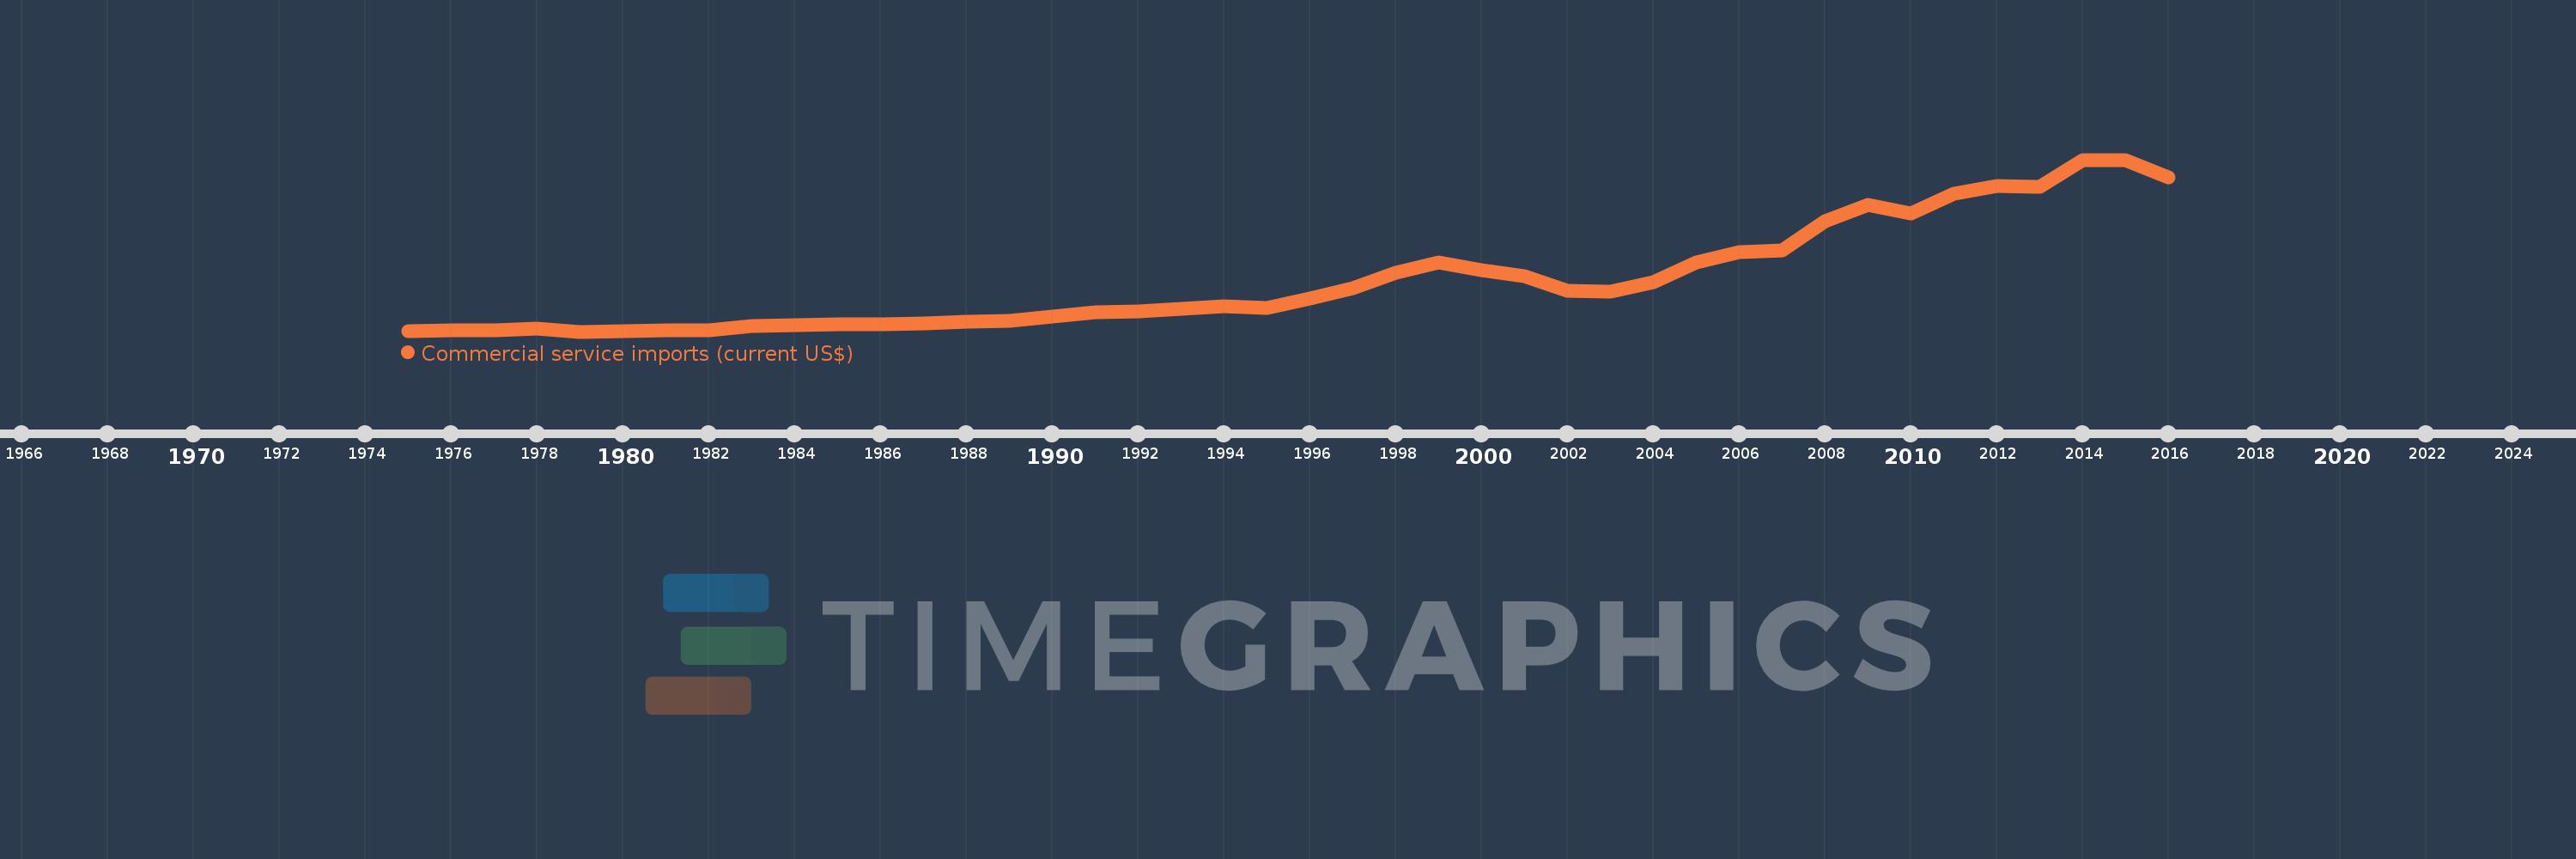
Commercial service imports (current US$)
2016,2015,2014,2013,2012,2011,2010,2009,2008,2007,2006,2005,2004,2003,2002,2001,2000,1999,1998,1997,1996,1995,1994,1993,1992,1991,1990,1989,1988,1987,1986,1985,1984,1983,1982,1981,1980,1979,1978,1977,1976,1975
Cette statistique dans les autres pays:
AfghanistanAlbaniaAlgeriaAngolaAntigua and BarbudaArab WorldArgentinaArmeniaArubaAustraliaAustriaAzerbaijanBahamas, TheBahrainBangladeshBarbadosBelarusBelgiumBelizeBeninBermudaBhutanBoliviaBosnia and HerzegovinaBotswanaBrazilBrunei DarussalamBulgariaBurkina FasoBurundiCabo VerdeCambodiaCameroonCanadaCaribbean small statesCentral African RepublicCentral Europe and the BalticsChadChileChinaColombiaComorosCongo, Dem. Rep.Congo, Rep.Costa RicaCote d'IvoireCroatiaCuracaoCyprusCzech RepublicDenmarkDjiboutiDominicaDominican RepublicEarly-demographic dividendEast Asia & PacificEast Asia & Pacific (excluding high income)East Asia & Pacific (IDA & IBRD countries)EcuadorEgypt, Arab Rep.El SalvadorEquatorial GuineaEritreaEstoniaEthiopiaEuro areaEurope & Central AsiaEurope & Central Asia (excluding high income)Europe & Central Asia (IDA & IBRD countries)European UnionFaroe IslandsFijiFinlandFragile and conflict affected situationsFranceFrench PolynesiaGabonGambia, TheGeorgiaGermanyGhanaGreeceGrenadaGuatemalaGuineaGuinea-BissauGuyanaHaitiHeavily indebted poor countries (HIPC)High incomeHondurasHong Kong SAR, ChinaHungaryIBRD onlyIcelandIDA & IBRD totalIDA blendIDA onlyIDA totalIndiaIndonesiaIran, Islamic Rep.IraqIrelandIsraelItalyJamaicaJapanJordanKazakhstanKenyaKiribatiKorea, Rep.KosovoKuwaitKyrgyz RepublicLao PDRLate-demographic dividendLatin America & Caribbean Latin America & Caribbean (excluding high income)Latin America & the Caribbean (IDA & IBRD countries)LatviaLeast developed countries: UN classificationLebanonLesothoLiberiaLibyaLithuaniaLow & middle incomeLow incomeLower middle incomeLuxembourgMacao SAR, ChinaMacedonia, FYRMadagascarMalawiMalaysiaMaldivesMaliMaltaMarshall IslandsMauritaniaMauritiusMexicoMicronesia, Fed. Sts.Middle East & North Africa (excluding high income)Middle East & North Africa (IDA & IBRD countries)Middle incomeMoldovaMongoliaMontenegroMoroccoMozambiqueMyanmarNamibiaNepalNetherlandsNew CaledoniaNew ZealandNicaraguaNigerNigeriaNorth AmericaNorwayOECD membersOmanOther small statesPacific island small statesPakistanPalauPanamaPapua New GuineaParaguayPeruPhilippinesPolandPortugalPost-demographic dividendPre-demographic dividendQatarRomaniaRussian FederationRwandaSamoaSao Tome and PrincipeSaudi ArabiaSenegalSerbiaSeychellesSierra LeoneSingaporeSint Maarten (Dutch part)Slovak RepublicSloveniaSmall statesSolomon IslandsSouth AfricaSouth AsiaSouth Asia (IDA & IBRD)South SudanSpainSri LankaSt. Kitts and NevisSt. LuciaSt. Vincent and the GrenadinesSub-Saharan Africa Sub-Saharan Africa (excluding high income)Sub-Saharan Africa (IDA & IBRD countries)SudanSurinameSwazilandSwedenSwitzerlandSyrian Arab RepublicTajikistanTanzaniaThailandTimor-LesteTogoTongaTrinidad and TobagoTunisiaTurkeyTuvaluUgandaUkraineUnited KingdomUnited StatesUpper middle incomeUruguayVanuatuVenezuela, RBVietnamWest Bank and GazaWorldYemen, Rep.ZambiaZimbabwe La ligne de temps
Cette échelle de temps montre un graphique de 1975 année à 2016 année Turkey. Les données jusqu'à 1974 année ne sont pas présentés. Quantité d'observations actuelles selon dates: 42.
Source (désignation):
Les indicateurs du développement mondiale
Source (organisation):
International Monetary Fund, Balance of Payments Statistics Yearbook and data files.
Catégories:
Private Sector, Trade
Dernière mise à jour
23 avr. 2017
Les indicateurs de changement de valeurs selon les années
Minimum:
242.0 mln.
1 janv. 1979
Maximum:
23.054 mds
1 janv. 2015
Pour la date d''observation
Valeur
Changement absolu
Le changement par rapport à la valeur précédente
1 janv. 1975
311.0 mln.
+311.0 mln.
0.0%
1 janv. 1976
372.0 mln.
+61.0 mln.
19.61%
1 janv. 1977
436.0 mln.
+64.0 mln.
17.2%
1 janv. 1978
623.0 mln.
+187.0 mln.
42.89%
1 janv. 1979
242.0 mln.
-381.0 mln.
-61.16%
1 janv. 1980
293.0 mln.
+51.0 mln.
21.07%
1 janv. 1981
466.0 mln.
+173.0 mln.
59.04%
1 janv. 1982
387.0 mln.
-79.0 mln.
-16.95%
1 janv. 1983
950.0 mln.
+563.0 mln.
145.48%
1 janv. 1984
1.073 mds
+123.0 mln.
12.95%
1 janv. 1985
1.169 mds
+96.0 mln.
8.95%
1 janv. 1986
1.224 mds
+55.0 mln.
4.7%
1 janv. 1987
1.288 mds
+64.0 mln.
5.23%
1 janv. 1988
1.555 mds
+267.0 mln.
20.73%
1 janv. 1989
1.701 mds
+146.0 mln.
9.39%
1 janv. 1990
2.208 mds
+507.0 mln.
29.81%
1 janv. 1991
2.794 mds
+586.0 mln.
26.54%
1 janv. 1992
2.931 mds
+137.0 mln.
4.9%
1 janv. 1993
3.277 mds
+346.0 mln.
11.8%
1 janv. 1994
3.591 mds
+314.0 mln.
9.58%
1 janv. 1995
3.418 mds
-173.0 mln.
-4.82%
1 janv. 1996
4.654 mds
+1.236 mds
36.16%
1 janv. 1997
6.034 mds
+1.38 mds
29.65%
1 janv. 1998
8.085 mds
+2.051 mds
33.99%
1 janv. 1999
9.439 mds
+1.354 mds
16.75%
1 janv. 2000
8.449 mds
-990.0 mln.
-10.49%
1 janv. 2001
7.624 mds
-825.0 mln.
-9.76%
1 janv. 2002
5.633 mds
-1.991 mds
-26.11%
1 janv. 2003
5.513 mds
-120.0 mln.
-2.13%
1 janv. 2004
6.824 mds
+1.311 mds
23.78%
1 janv. 2005
9.378 mds
+2.554 mds
37.43%
1 janv. 2006
10.756 mds
+1.378 mds
14.69%
1 janv. 2007
11.017 mds
+261.0 mln.
2.43%
1 janv. 2008
14.933 mds
+3.916 mds
35.55%
1 janv. 2009
17.092 mds
+2.159 mds
14.46%
1 janv. 2010
15.971 mds
-1.121 mds
-6.56%
1 janv. 2011
18.507 mds
+2.536 mds
15.88%
1 janv. 2012
19.574 mds
+1.067 mds
5.77%
1 janv. 2013
19.422 mds
-152.0 mln.
-0.78%
1 janv. 2014
23.018 mds
+3.596 mds
18.52%
1 janv. 2015
23.054 mds
+36.0 mln.
0.16%
1 janv. 2016
20.66 mds
-2.394 mds
-10.38%
Classement des pays selon les statistiques actuelles par années


Commentaires: