29
/fr/
fr
AIzaSyAYiBZKx7MnpbEhh9jyipgxe19OcubqV5w
April 1, 2024
125934
El Salvador
SLV
true
2
1
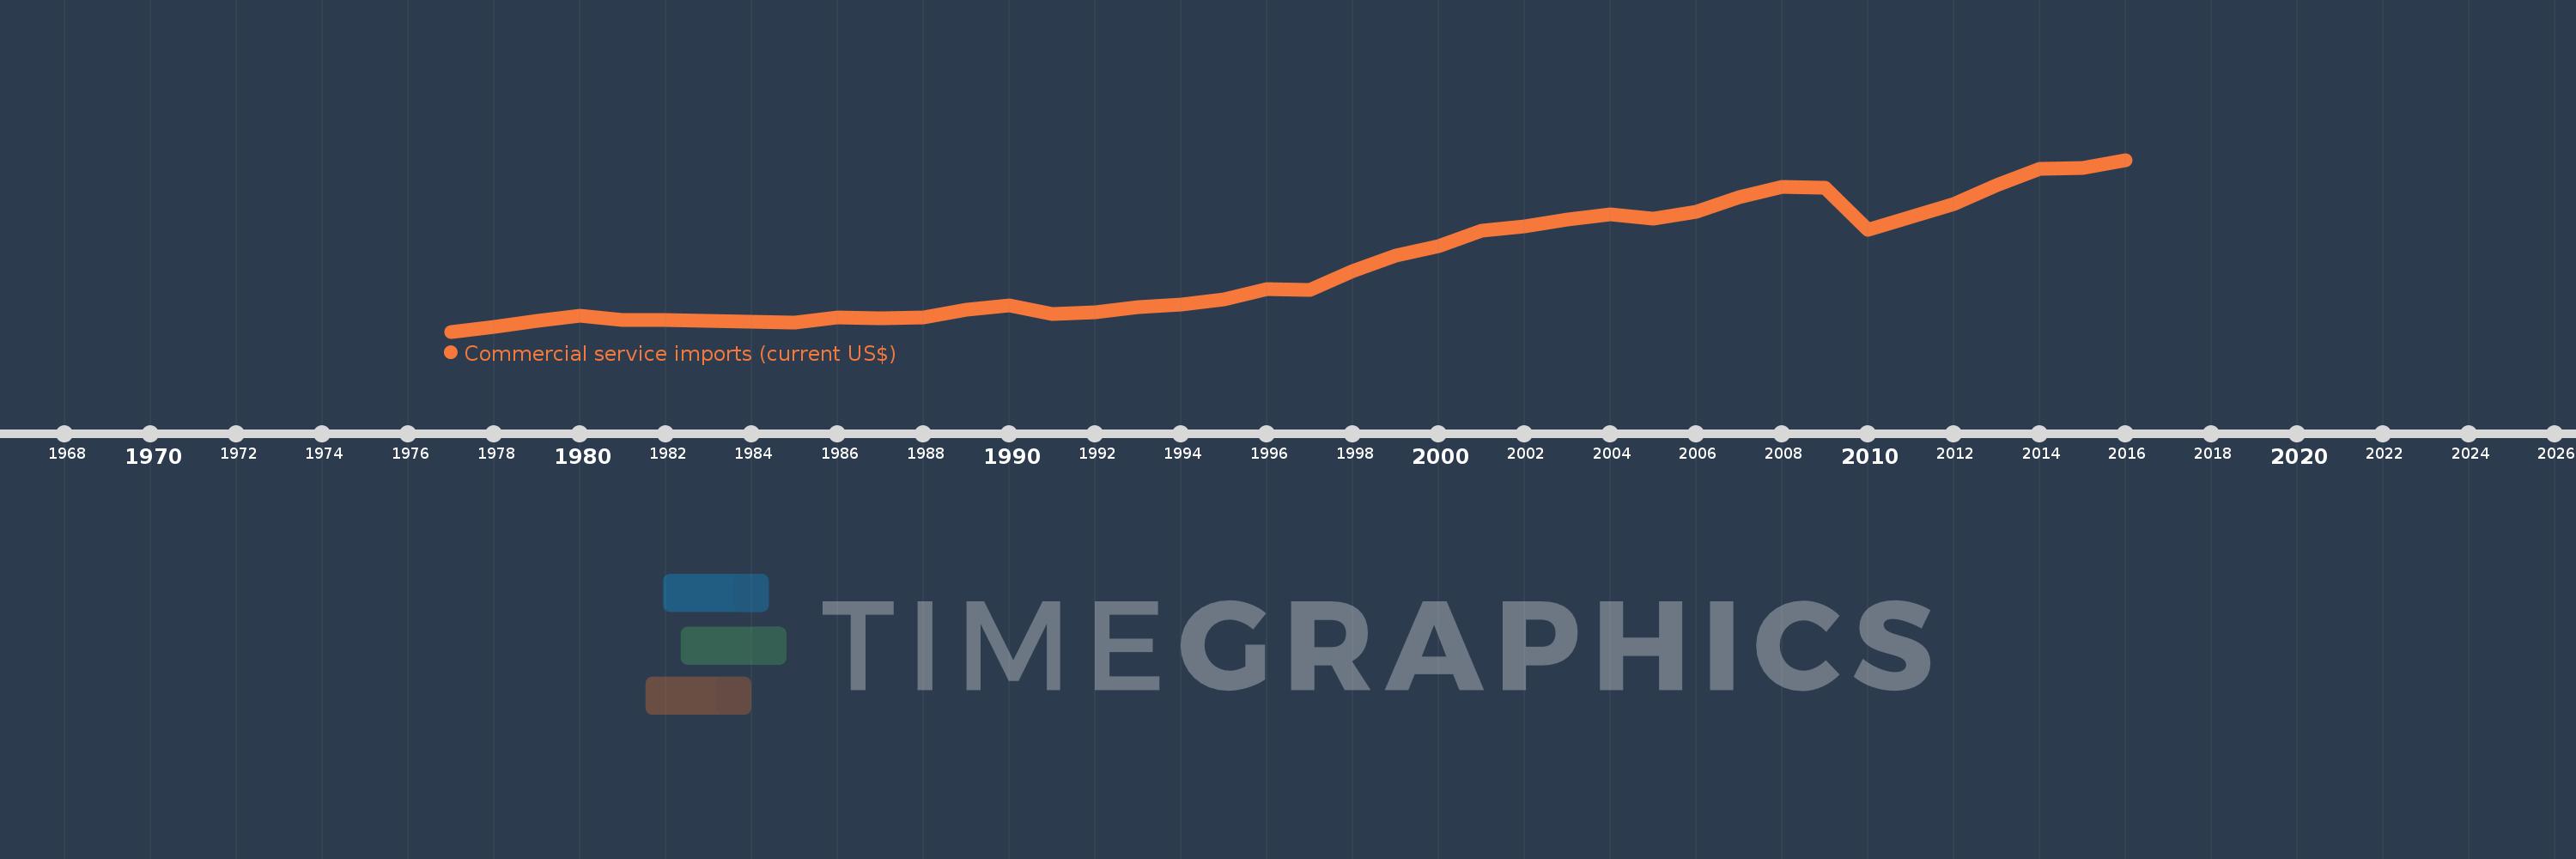
Commercial service imports (current US$)
2016,2015,2014,2013,2012,2011,2010,2009,2008,2007,2006,2005,2004,2003,2002,2001,2000,1999,1998,1997,1996,1995,1994,1993,1992,1991,1990,1989,1988,1987,1986,1985,1984,1983,1982,1981,1980,1979,1978,1977
Cette statistique dans les autres pays:
AfghanistanAlbaniaAlgeriaAngolaAntigua and BarbudaArab WorldArgentinaArmeniaArubaAustraliaAustriaAzerbaijanBahamas, TheBahrainBangladeshBarbadosBelarusBelgiumBelizeBeninBermudaBhutanBoliviaBosnia and HerzegovinaBotswanaBrazilBrunei DarussalamBulgariaBurkina FasoBurundiCabo VerdeCambodiaCameroonCanadaCaribbean small statesCentral African RepublicCentral Europe and the BalticsChadChileChinaColombiaComorosCongo, Dem. Rep.Congo, Rep.Costa RicaCote d'IvoireCroatiaCuracaoCyprusCzech RepublicDenmarkDjiboutiDominicaDominican RepublicEarly-demographic dividendEast Asia & PacificEast Asia & Pacific (excluding high income)East Asia & Pacific (IDA & IBRD countries)EcuadorEgypt, Arab Rep.El SalvadorEquatorial GuineaEritreaEstoniaEthiopiaEuro areaEurope & Central AsiaEurope & Central Asia (excluding high income)Europe & Central Asia (IDA & IBRD countries)European UnionFaroe IslandsFijiFinlandFragile and conflict affected situationsFranceFrench PolynesiaGabonGambia, TheGeorgiaGermanyGhanaGreeceGrenadaGuatemalaGuineaGuinea-BissauGuyanaHaitiHeavily indebted poor countries (HIPC)High incomeHondurasHong Kong SAR, ChinaHungaryIBRD onlyIcelandIDA & IBRD totalIDA blendIDA onlyIDA totalIndiaIndonesiaIran, Islamic Rep.IraqIrelandIsraelItalyJamaicaJapanJordanKazakhstanKenyaKiribatiKorea, Rep.KosovoKuwaitKyrgyz RepublicLao PDRLate-demographic dividendLatin America & Caribbean Latin America & Caribbean (excluding high income)Latin America & the Caribbean (IDA & IBRD countries)LatviaLeast developed countries: UN classificationLebanonLesothoLiberiaLibyaLithuaniaLow & middle incomeLow incomeLower middle incomeLuxembourgMacao SAR, ChinaMacedonia, FYRMadagascarMalawiMalaysiaMaldivesMaliMaltaMarshall IslandsMauritaniaMauritiusMexicoMicronesia, Fed. Sts.Middle East & North Africa (excluding high income)Middle East & North Africa (IDA & IBRD countries)Middle incomeMoldovaMongoliaMontenegroMoroccoMozambiqueMyanmarNamibiaNepalNetherlandsNew CaledoniaNew ZealandNicaraguaNigerNigeriaNorth AmericaNorwayOECD membersOmanOther small statesPacific island small statesPakistanPalauPanamaPapua New GuineaParaguayPeruPhilippinesPolandPortugalPost-demographic dividendPre-demographic dividendQatarRomaniaRussian FederationRwandaSamoaSao Tome and PrincipeSaudi ArabiaSenegalSerbiaSeychellesSierra LeoneSingaporeSint Maarten (Dutch part)Slovak RepublicSloveniaSmall statesSolomon IslandsSouth AfricaSouth AsiaSouth Asia (IDA & IBRD)South SudanSpainSri LankaSt. Kitts and NevisSt. LuciaSt. Vincent and the GrenadinesSub-Saharan Africa Sub-Saharan Africa (excluding high income)Sub-Saharan Africa (IDA & IBRD countries)SudanSurinameSwazilandSwedenSwitzerlandSyrian Arab RepublicTajikistanTanzaniaThailandTimor-LesteTogoTongaTrinidad and TobagoTunisiaTurkeyTuvaluUgandaUkraineUnited KingdomUnited StatesUpper middle incomeUruguayVanuatuVenezuela, RBVietnamWest Bank and GazaWorldYemen, Rep.ZambiaZimbabwe La ligne de temps
Cette échelle de temps montre un graphique de 1977 année à 2016 année El Salvador. Les données jusqu'à 1976 année ne sont pas présentés. Quantité d'observations actuelles selon dates: 40.
Source (désignation):
Les indicateurs du développement mondiale
Source (organisation):
International Monetary Fund, Balance of Payments Statistics Yearbook and data files.
Catégories:
Private Sector, Trade
Dernière mise à jour
23 avr. 2017
Les indicateurs de changement de valeurs selon les années
Minimum:
159.6 mln.
1 janv. 1977
Maximum:
1.497 mds
1 janv. 2016
Pour la date d''observation
Valeur
Changement absolu
Le changement par rapport à la valeur précédente
1 janv. 1977
159.6 mln.
+159.6 mln.
0.0%
1 janv. 1978
197.44 mln.
+37.84 mln.
23.71%
1 janv. 1979
246.4 mln.
+48.96 mln.
24.8%
1 janv. 1980
280.08 mln.
+33.68 mln.
13.67%
1 janv. 1981
251.24 mln.
-28.84 mln.
-10.3%
1 janv. 1982
253.0 mln.
+1.76 mln.
0.7%
1 janv. 1983
243.28 mln.
-9.72 mln.
-3.84%
1 janv. 1984
238.36 mln.
-4.92 mln.
-2.02%
1 janv. 1985
230.32 mln.
-8.04 mln.
-3.37%
1 janv. 1986
271.0 mln.
+40.68 mln.
17.66%
1 janv. 1987
265.017 mln.
-5.983 mln.
-2.21%
1 janv. 1988
270.1 mln.
+5.083 mln.
1.92%
1 janv. 1989
330.5 mln.
+60.4 mln.
22.36%
1 janv. 1990
365.3 mln.
+34.8 mln.
10.53%
1 janv. 1991
295.984 mln.
-69.316 mln.
-18.97%
1 janv. 1992
307.896 mln.
+11.912 mln.
4.02%
1 janv. 1993
348.649 mln.
+40.753 mln.
13.24%
1 janv. 1994
369.893 mln.
+21.244 mln.
6.09%
1 janv. 1995
408.535 mln.
+38.642 mln.
10.45%
1 janv. 1996
487.63 mln.
+79.095 mln.
19.36%
1 janv. 1997
481.325 mln.
-6.305 mln.
-1.29%
1 janv. 1998
634.518 mln.
+153.193 mln.
31.83%
1 janv. 1999
748.943 mln.
+114.425 mln.
18.03%
1 janv. 2000
823.0 mln.
+74.057 mln.
9.89%
1 janv. 2001
947.3 mln.
+124.3 mln.
15.1%
1 janv. 2002
977.8 mln.
+30.5 mln.
3.22%
1 janv. 2003
1.031 mds
+53.2 mln.
5.44%
1 janv. 2004
1.075 mds
+44.21 mln.
4.29%
1 janv. 2005
1.037 mds
-37.938 mln.
-3.53%
1 janv. 2006
1.093 mds
+55.678 mln.
5.37%
1 janv. 2007
1.205 mds
+112.52 mln.
10.3%
1 janv. 2008
1.29 mds
+84.59 mln.
7.02%
1 janv. 2009
1.277 mds
-12.69 mln.
-0.98%
1 janv. 2010
952.258 mln.
-325.112 mln.
-25.45%
1 janv. 2011
1.054 mds
+101.982 mln.
10.71%
1 janv. 2012
1.152 mds
+98.042 mln.
9.3%
1 janv. 2013
1.301 mds
+149.059 mln.
12.94%
1 janv. 2014
1.429 mds
+127.532 mln.
9.8%
1 janv. 2015
1.433 mds
+3.922 mln.
0.27%
1 janv. 2016
1.497 mds
+64.663 mln.
4.51%
Classement des pays selon les statistiques actuelles par années


Commentaires: