29
/fr/
fr
AIzaSyAYiBZKx7MnpbEhh9jyipgxe19OcubqV5w
April 1, 2024
218093
Panama
PAN
true
2
1
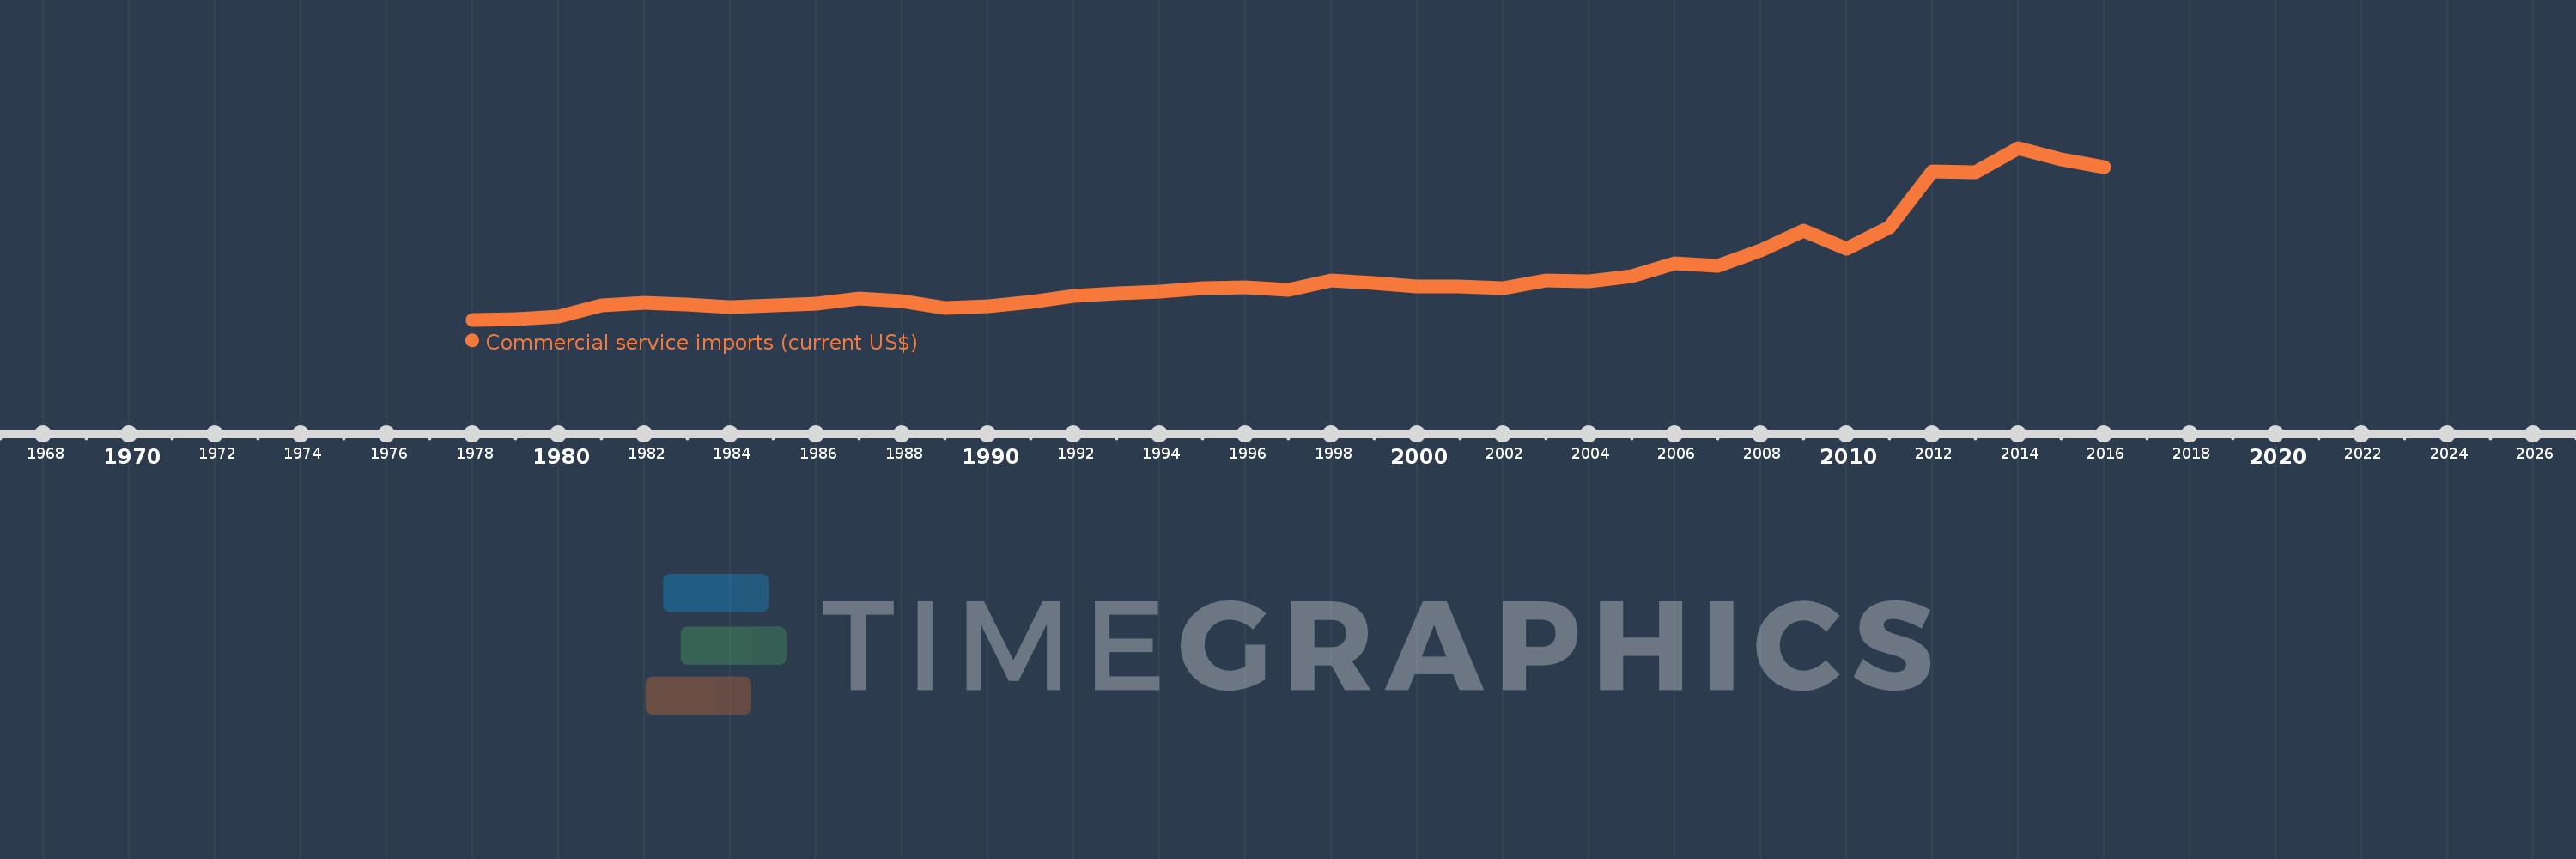
Commercial service imports (current US$)
2016,2015,2014,2013,2012,2011,2010,2009,2008,2007,2006,2005,2004,2003,2002,2001,2000,1999,1998,1997,1996,1995,1994,1993,1992,1991,1990,1989,1988,1987,1986,1985,1984,1983,1982,1981,1980,1979,1978
Cette statistique dans les autres pays:
AfghanistanAlbaniaAlgeriaAngolaAntigua and BarbudaArab WorldArgentinaArmeniaArubaAustraliaAustriaAzerbaijanBahamas, TheBahrainBangladeshBarbadosBelarusBelgiumBelizeBeninBermudaBhutanBoliviaBosnia and HerzegovinaBotswanaBrazilBrunei DarussalamBulgariaBurkina FasoBurundiCabo VerdeCambodiaCameroonCanadaCaribbean small statesCentral African RepublicCentral Europe and the BalticsChadChileChinaColombiaComorosCongo, Dem. Rep.Congo, Rep.Costa RicaCote d'IvoireCroatiaCuracaoCyprusCzech RepublicDenmarkDjiboutiDominicaDominican RepublicEarly-demographic dividendEast Asia & PacificEast Asia & Pacific (excluding high income)East Asia & Pacific (IDA & IBRD countries)EcuadorEgypt, Arab Rep.El SalvadorEquatorial GuineaEritreaEstoniaEthiopiaEuro areaEurope & Central AsiaEurope & Central Asia (excluding high income)Europe & Central Asia (IDA & IBRD countries)European UnionFaroe IslandsFijiFinlandFragile and conflict affected situationsFranceFrench PolynesiaGabonGambia, TheGeorgiaGermanyGhanaGreeceGrenadaGuatemalaGuineaGuinea-BissauGuyanaHaitiHeavily indebted poor countries (HIPC)High incomeHondurasHong Kong SAR, ChinaHungaryIBRD onlyIcelandIDA & IBRD totalIDA blendIDA onlyIDA totalIndiaIndonesiaIran, Islamic Rep.IraqIrelandIsraelItalyJamaicaJapanJordanKazakhstanKenyaKiribatiKorea, Rep.KosovoKuwaitKyrgyz RepublicLao PDRLate-demographic dividendLatin America & Caribbean Latin America & Caribbean (excluding high income)Latin America & the Caribbean (IDA & IBRD countries)LatviaLeast developed countries: UN classificationLebanonLesothoLiberiaLibyaLithuaniaLow & middle incomeLow incomeLower middle incomeLuxembourgMacao SAR, ChinaMacedonia, FYRMadagascarMalawiMalaysiaMaldivesMaliMaltaMarshall IslandsMauritaniaMauritiusMexicoMicronesia, Fed. Sts.Middle East & North Africa (excluding high income)Middle East & North Africa (IDA & IBRD countries)Middle incomeMoldovaMongoliaMontenegroMoroccoMozambiqueMyanmarNamibiaNepalNetherlandsNew CaledoniaNew ZealandNicaraguaNigerNigeriaNorth AmericaNorwayOECD membersOmanOther small statesPacific island small statesPakistanPalauPanamaPapua New GuineaParaguayPeruPhilippinesPolandPortugalPost-demographic dividendPre-demographic dividendQatarRomaniaRussian FederationRwandaSamoaSao Tome and PrincipeSaudi ArabiaSenegalSerbiaSeychellesSierra LeoneSingaporeSint Maarten (Dutch part)Slovak RepublicSloveniaSmall statesSolomon IslandsSouth AfricaSouth AsiaSouth Asia (IDA & IBRD)South SudanSpainSri LankaSt. Kitts and NevisSt. LuciaSt. Vincent and the GrenadinesSub-Saharan Africa Sub-Saharan Africa (excluding high income)Sub-Saharan Africa (IDA & IBRD countries)SudanSurinameSwazilandSwedenSwitzerlandSyrian Arab RepublicTajikistanTanzaniaThailandTimor-LesteTogoTongaTrinidad and TobagoTunisiaTurkeyTuvaluUgandaUkraineUnited KingdomUnited StatesUpper middle incomeUruguayVanuatuVenezuela, RBVietnamWest Bank and GazaWorldYemen, Rep.ZambiaZimbabwe La ligne de temps
Cette échelle de temps montre un graphique de 1978 année à 2016 année Panama. Les données jusqu'à 1977 année ne sont pas présentés. Quantité d'observations actuelles selon dates: 39.
Source (désignation):
Les indicateurs du développement mondiale
Source (organisation):
International Monetary Fund, Balance of Payments Statistics Yearbook and data files.
Catégories:
Private Sector, Trade
Dernière mise à jour
23 avr. 2017
Les indicateurs de changement de valeurs selon les années
Minimum:
177.8 mln.
1 janv. 1978
Maximum:
4.867 mds
1 janv. 2014
Pour la date d''observation
Valeur
Changement absolu
Le changement par rapport à la valeur précédente
1 janv. 1978
177.8 mln.
+177.8 mln.
0.0%
1 janv. 1979
203.4 mln.
+25.6 mln.
14.4%
1 janv. 1980
256.1 mln.
+52.7 mln.
25.91%
1 janv. 1981
567.2 mln.
+311.1 mln.
121.48%
1 janv. 1982
645.0 mln.
+77.8 mln.
13.72%
1 janv. 1983
602.8 mln.
-42.2 mln.
-6.54%
1 janv. 1984
518.3 mln.
-84.5 mln.
-14.02%
1 janv. 1985
568.3 mln.
+50.0 mln.
9.65%
1 janv. 1986
622.4 mln.
+54.1 mln.
9.52%
1 janv. 1987
760.1 mln.
+137.7 mln.
22.12%
1 janv. 1988
680.4 mln.
-79.7 mln.
-10.49%
1 janv. 1989
499.1 mln.
-181.3 mln.
-26.65%
1 janv. 1990
556.2 mln.
+57.1 mln.
11.44%
1 janv. 1991
666.9 mln.
+110.7 mln.
19.9%
1 janv. 1992
821.2 mln.
+154.3 mln.
23.14%
1 janv. 1993
886.4 mln.
+65.2 mln.
7.94%
1 janv. 1994
943.0 mln.
+56.6 mln.
6.39%
1 janv. 1995
1.031 mds
+87.6 mln.
9.29%
1 janv. 1996
1.051 mds
+20.2 mln.
1.96%
1 janv. 1997
1.002 mds
-49.0 mln.
-4.66%
1 janv. 1998
1.249 mds
+247.4 mln.
24.7%
1 janv. 1999
1.186 mds
-63.5 mln.
-5.08%
1 janv. 2000
1.085 mds
-100.8 mln.
-8.5%
1 janv. 2001
1.083 mds
-1.5 mln.
-0.14%
1 janv. 2002
1.047 mds
-36.8 mln.
-3.4%
1 janv. 2003
1.241 mds
+194.6 mln.
18.59%
1 janv. 2004
1.234 mds
-6.7 mln.
-0.54%
1 janv. 2005
1.37 mds
+135.7 mln.
10.99%
1 janv. 2006
1.718 mds
+347.7 mln.
25.38%
1 janv. 2007
1.641 mds
-77.0 mln.
-4.48%
1 janv. 2008
2.078 mds
+436.8 mln.
26.62%
1 janv. 2009
2.602 mds
+524.5 mln.
25.24%
1 janv. 2010
2.118 mds
-484.1 mln.
-18.6%
1 janv. 2011
2.709 mds
+590.8 mln.
27.89%
1 janv. 2012
4.235 mds
+1.526 mds
56.32%
1 janv. 2013
4.214 mds
-20.7 mln.
-0.49%
1 janv. 2014
4.867 mds
+653.6 mln.
15.51%
1 janv. 2015
4.546 mds
-321.8 mln.
-6.61%
1 janv. 2016
4.355 mds
-190.9 mln.
-4.2%
Classement des pays selon les statistiques actuelles par années


Commentaires: