29
/fr/
fr
AIzaSyAYiBZKx7MnpbEhh9jyipgxe19OcubqV5w
April 1, 2024
59196
Sub-Saharan Africa
SSF
false
2
1
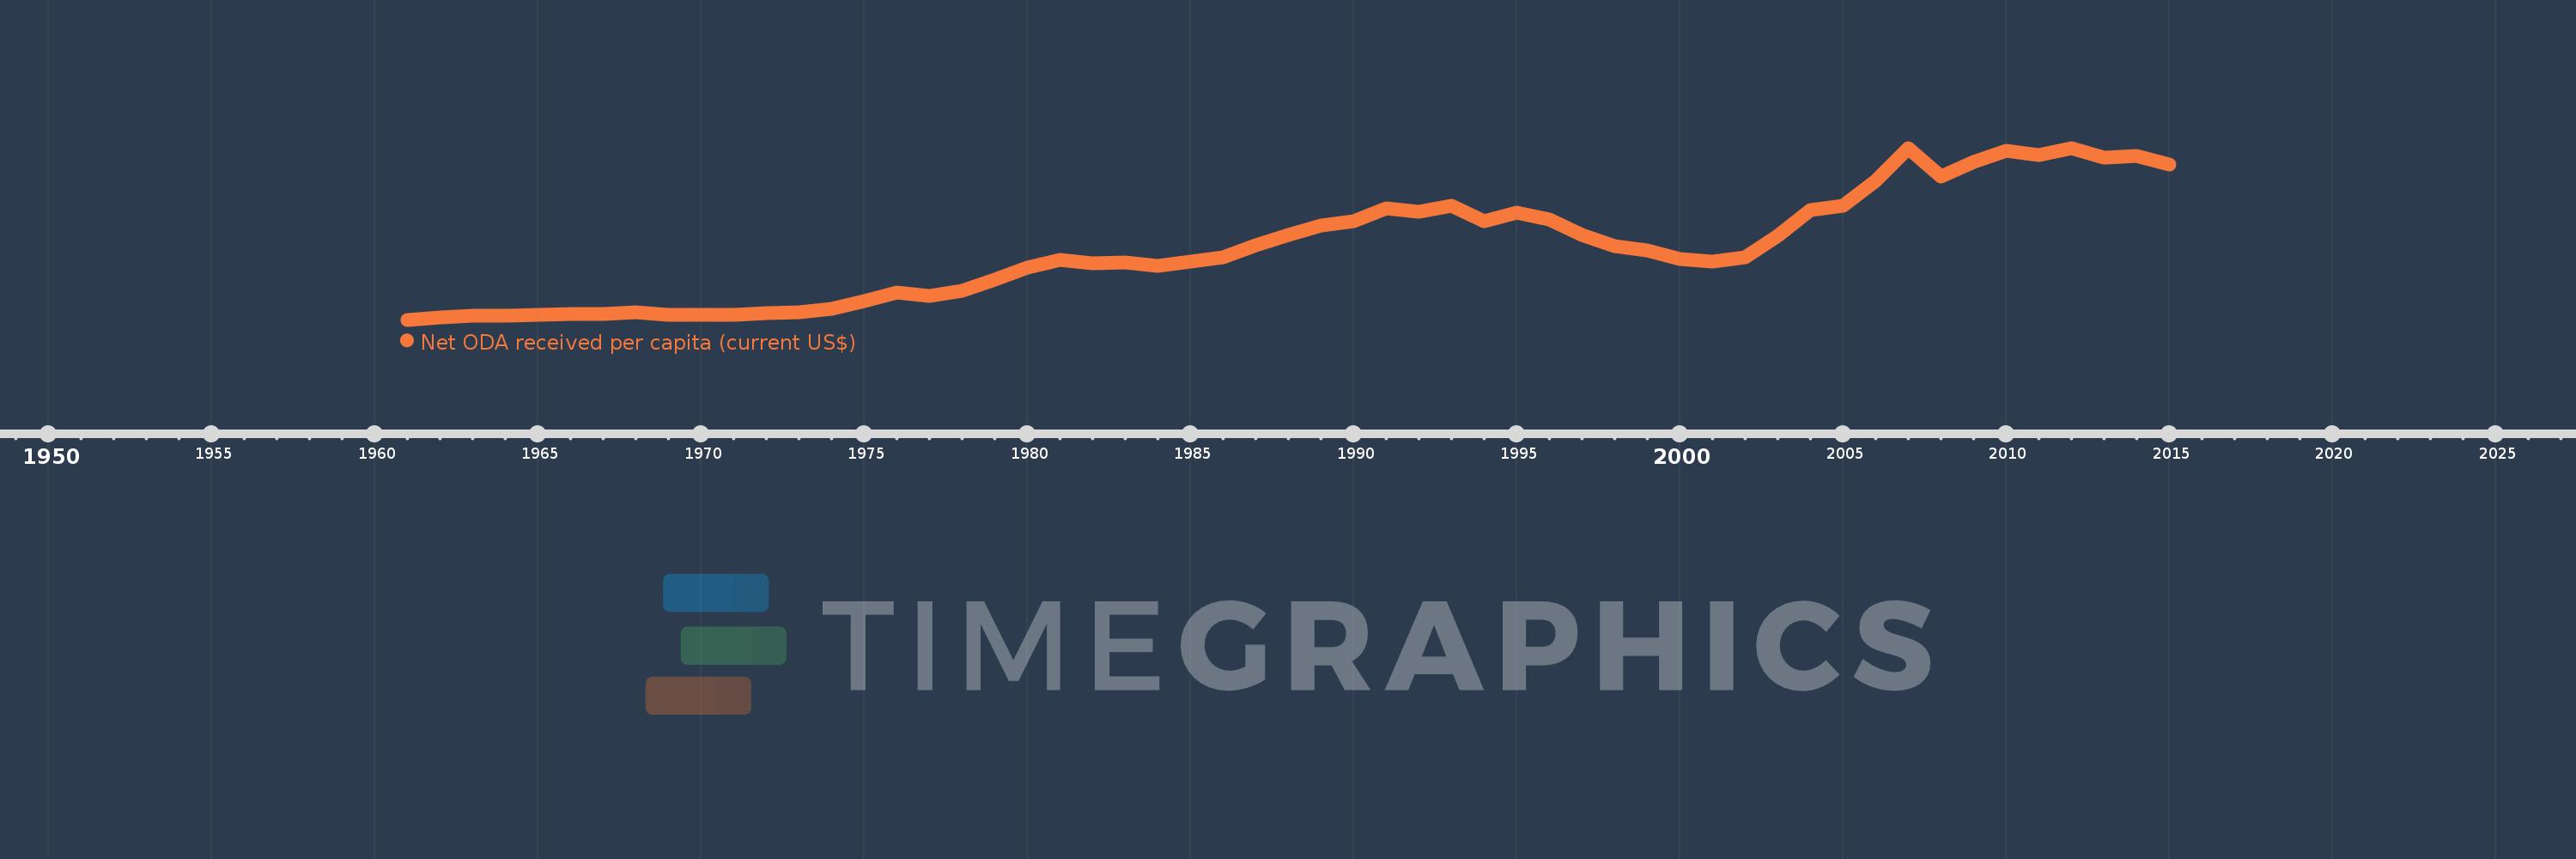
Net ODA received per capita (current US$)
2015,2014,2013,2012,2011,2010,2009,2008,2007,2006,2005,2004,2003,2002,2001,2000,1999,1998,1997,1996,1995,1994,1993,1992,1991,1990,1989,1988,1987,1986,1985,1984,1983,1982,1981,1980,1979,1978,1977,1976,1975,1974,1973,1972,1971,1970,1969,1968,1967,1966,1965,1964,1963,1962,1961
Cette statistique dans les autres pays:
AfghanistanAlbaniaAlgeriaAngolaAntigua and BarbudaArab WorldArgentinaArmeniaArubaAzerbaijanBahamas, TheBahrainBangladeshBarbadosBelarusBelizeBeninBermudaBhutanBoliviaBosnia and HerzegovinaBotswanaBrazilBritish Virgin IslandsBrunei DarussalamBurkina FasoBurundiCabo VerdeCambodiaCameroonCaribbean small statesCayman IslandsCentral African RepublicCentral Europe and the BalticsChadChileChinaColombiaComorosCongo, Dem. Rep.Congo, Rep.Costa RicaCote d'IvoireCroatiaCubaCyprusDjiboutiDominicaDominican RepublicEast Asia & PacificEast Asia & Pacific (excluding high income)East Asia & Pacific (IDA & IBRD countries)EcuadorEgypt, Arab Rep.El SalvadorEquatorial GuineaEritreaEthiopiaEuro areaEurope & Central AsiaEurope & Central Asia (excluding high income)Europe & Central Asia (IDA & IBRD countries)European UnionFijiFragile and conflict affected situationsFrench PolynesiaGabonGambia, TheGeorgiaGhanaGibraltarGrenadaGuatemalaGuineaGuinea-BissauGuyanaHaitiHeavily indebted poor countries (HIPC)High incomeHondurasHong Kong SAR, ChinaIBRD onlyIDA & IBRD totalIDA blendIDA onlyIDA totalIndiaIndonesiaIran, Islamic Rep.IraqIsraelJamaicaJordanKazakhstanKenyaKiribatiKorea, Dem. People’s Rep.Korea, Rep.KosovoKuwaitKyrgyz RepublicLao PDRLatin America & Caribbean Latin America & Caribbean (excluding high income)Latin America & the Caribbean (IDA & IBRD countries)Least developed countries: UN classificationLebanonLesothoLiberiaLibyaLow & middle incomeLow incomeLower middle incomeMacao SAR, ChinaMacedonia, FYRMadagascarMalawiMalaysiaMaldivesMaliMaltaMarshall IslandsMauritaniaMauritiusMexicoMicronesia, Fed. Sts.Middle East & North AfricaMiddle East & North Africa (excluding high income)Middle East & North Africa (IDA & IBRD countries)Middle incomeMoldovaMongoliaMontenegroMoroccoMozambiqueMyanmarNamibiaNauruNepalNew CaledoniaNicaraguaNigerNigeriaNorth AmericaNorthern Mariana IslandsOECD membersOmanOther small statesPacific island small statesPakistanPalauPanamaPapua New GuineaParaguayPeruPhilippinesQatarRwandaSamoaSao Tome and PrincipeSaudi ArabiaSenegalSerbiaSeychellesSierra LeoneSingaporeSloveniaSmall statesSolomon IslandsSomaliaSouth AfricaSouth AsiaSouth Asia (IDA & IBRD)South SudanSri LankaSt. Kitts and NevisSt. LuciaSt. Vincent and the GrenadinesSub-Saharan Africa Sub-Saharan Africa (excluding high income)Sub-Saharan Africa (IDA & IBRD countries)SudanSurinameSwazilandSyrian Arab RepublicTajikistanTanzaniaThailandTimor-LesteTogoTongaTrinidad and TobagoTunisiaTurkeyTurkmenistanTurks and Caicos IslandsTuvaluUgandaUkraineUnited Arab EmiratesUpper middle incomeUruguayUzbekistanVanuatuVenezuela, RBVietnamWest Bank and GazaWorldYemen, Rep.ZambiaZimbabwe La ligne de temps
Cette échelle de temps montre un graphique de 1961 année à 2015 année Sub-Saharan Africa . Les données jusqu'à 1960 année ne sont pas présentés. Quantité d'observations actuelles selon dates: 55.
Source (désignation):
Les indicateurs du développement mondiale
Source (organisation):
Development Assistance Committee of the Organisation for Economic Co-operation and Development, Geographical Distribution of Financial Flows to Developing Countries, Development Co-operation Report, and International Development Statistics database. Data are available online at: www.oecd.org/dac/stats/idsonline. World Bank population estimates are used for the denominator.
Catégories:
Aid Effectiveness, Economy & Growth, External Debt
Dernière mise à jour
23 avr. 2017
Les indicateurs de changement de valeurs selon les années
Minimum:
2.617
1 janv. 1961
Maximum:
52.636
1 janv. 2007
Pour la date d''observation
Valeur
Changement absolu
Le changement par rapport à la valeur précédente
1 janv. 1961
2.617
+2.617
0.0%
1 janv. 1962
3.414
+0.797
30.46%
1 janv. 1963
3.808
+0.394
11.54%
1 janv. 1964
3.691
-0.118
-3.09%
1 janv. 1965
4.024
+0.333
9.03%
1 janv. 1966
4.228
+0.204
5.07%
1 janv. 1967
4.417
+0.189
4.47%
1 janv. 1968
4.749
+0.332
7.51%
1 janv. 1969
4.155
-0.594
-12.5%
1 janv. 1970
3.959
-0.196
-4.71%
1 janv. 1971
4.017
+0.058
1.46%
1 janv. 1972
4.528
+0.51
12.7%
1 janv. 1973
4.729
+0.201
4.45%
1 janv. 1974
5.716
+0.987
20.87%
1 janv. 1975
8.019
+2.303
40.29%
1 janv. 1976
10.496
+2.477
30.89%
1 janv. 1977
9.422
-1.074
-10.23%
1 janv. 1978
10.927
+1.505
15.97%
1 janv. 1979
14.395
+3.468
31.74%
1 janv. 1980
17.896
+3.501
24.32%
1 janv. 1981
20.158
+2.262
12.64%
1 janv. 1982
19.006
-1.152
-5.72%
1 janv. 1983
19.392
+0.386
2.03%
1 janv. 1984
18.19
-1.202
-6.2%
1 janv. 1985
19.525
+1.336
7.34%
1 janv. 1986
20.882
+1.357
6.95%
1 janv. 1987
24.255
+3.373
16.15%
1 janv. 1988
27.417
+3.162
13.04%
1 janv. 1989
30.149
+2.732
9.96%
1 janv. 1990
31.342
+1.192
3.96%
1 janv. 1991
35.079
+3.738
11.93%
1 janv. 1992
34.078
-1.002
-2.86%
1 janv. 1993
35.751
+1.673
4.91%
1 janv. 1994
31.338
-4.413
-12.34%
1 janv. 1995
33.738
+2.4
7.66%
1 janv. 1996
31.877
-1.861
-5.52%
1 janv. 1997
27.216
-4.661
-14.62%
1 janv. 1998
24.126
-3.09
-11.35%
1 janv. 1999
22.815
-1.311
-5.43%
1 janv. 2000
20.278
-2.537
-11.12%
1 janv. 2001
19.484
-0.794
-3.92%
1 janv. 2002
20.811
+1.327
6.81%
1 janv. 2003
27.101
+6.29
30.22%
1 janv. 2004
34.506
+7.405
27.32%
1 janv. 2005
35.741
+1.235
3.58%
1 janv. 2006
43.11
+7.369
20.62%
1 janv. 2007
52.636
+9.526
22.1%
1 janv. 2008
44.237
-8.399
-15.96%
1 janv. 2009
48.676
+4.438
10.03%
1 janv. 2010
51.834
+3.158
6.49%
1 janv. 2011
50.662
-1.172
-2.26%
1 janv. 2012
52.619
+1.957
3.86%
1 janv. 2013
49.927
-2.692
-5.12%
1 janv. 2014
50.241
+0.314
0.63%
1 janv. 2015
47.77
-2.471
-4.92%
Classement des pays selon les statistiques actuelles par années


Commentaires: