29
/fr/
fr
AIzaSyAYiBZKx7MnpbEhh9jyipgxe19OcubqV5w
April 1, 2024
201974
Morocco
MAR
true
2
1
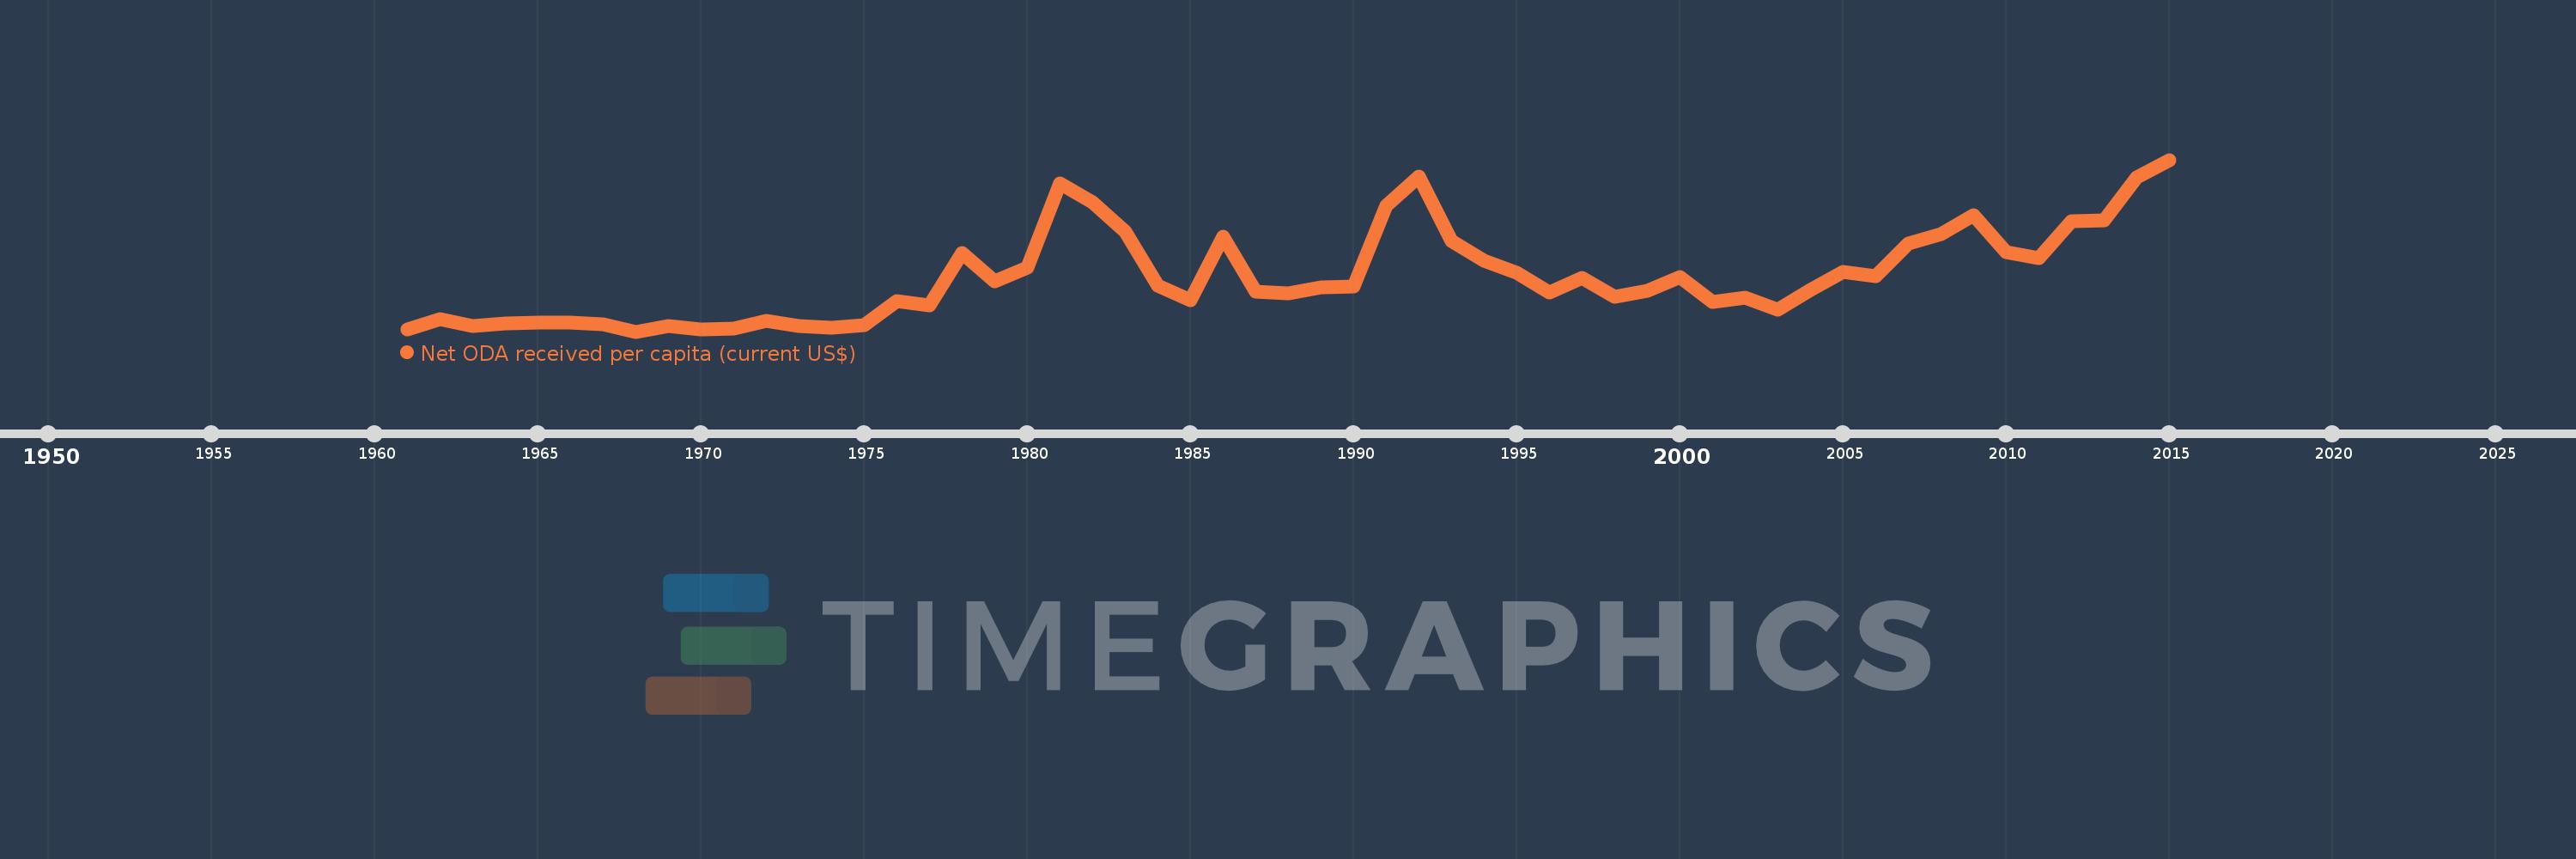
Net ODA received per capita (current US$)
2015,2014,2013,2012,2011,2010,2009,2008,2007,2006,2005,2004,2003,2002,2001,2000,1999,1998,1997,1996,1995,1994,1993,1992,1991,1990,1989,1988,1987,1986,1985,1984,1983,1982,1981,1980,1979,1978,1977,1976,1975,1974,1973,1972,1971,1970,1969,1968,1967,1966,1965,1964,1963,1962,1961
Cette statistique dans les autres pays:
AfghanistanAlbaniaAlgeriaAngolaAntigua and BarbudaArab WorldArgentinaArmeniaArubaAzerbaijanBahamas, TheBahrainBangladeshBarbadosBelarusBelizeBeninBermudaBhutanBoliviaBosnia and HerzegovinaBotswanaBrazilBritish Virgin IslandsBrunei DarussalamBurkina FasoBurundiCabo VerdeCambodiaCameroonCaribbean small statesCayman IslandsCentral African RepublicCentral Europe and the BalticsChadChileChinaColombiaComorosCongo, Dem. Rep.Congo, Rep.Costa RicaCote d'IvoireCroatiaCubaCyprusDjiboutiDominicaDominican RepublicEast Asia & PacificEast Asia & Pacific (excluding high income)East Asia & Pacific (IDA & IBRD countries)EcuadorEgypt, Arab Rep.El SalvadorEquatorial GuineaEritreaEthiopiaEuro areaEurope & Central AsiaEurope & Central Asia (excluding high income)Europe & Central Asia (IDA & IBRD countries)European UnionFijiFragile and conflict affected situationsFrench PolynesiaGabonGambia, TheGeorgiaGhanaGibraltarGrenadaGuatemalaGuineaGuinea-BissauGuyanaHaitiHeavily indebted poor countries (HIPC)High incomeHondurasHong Kong SAR, ChinaIBRD onlyIDA & IBRD totalIDA blendIDA onlyIDA totalIndiaIndonesiaIran, Islamic Rep.IraqIsraelJamaicaJordanKazakhstanKenyaKiribatiKorea, Dem. People’s Rep.Korea, Rep.KosovoKuwaitKyrgyz RepublicLao PDRLatin America & Caribbean Latin America & Caribbean (excluding high income)Latin America & the Caribbean (IDA & IBRD countries)Least developed countries: UN classificationLebanonLesothoLiberiaLibyaLow & middle incomeLow incomeLower middle incomeMacao SAR, ChinaMacedonia, FYRMadagascarMalawiMalaysiaMaldivesMaliMaltaMarshall IslandsMauritaniaMauritiusMexicoMicronesia, Fed. Sts.Middle East & North AfricaMiddle East & North Africa (excluding high income)Middle East & North Africa (IDA & IBRD countries)Middle incomeMoldovaMongoliaMontenegroMoroccoMozambiqueMyanmarNamibiaNauruNepalNew CaledoniaNicaraguaNigerNigeriaNorth AmericaNorthern Mariana IslandsOECD membersOmanOther small statesPacific island small statesPakistanPalauPanamaPapua New GuineaParaguayPeruPhilippinesQatarRwandaSamoaSao Tome and PrincipeSaudi ArabiaSenegalSerbiaSeychellesSierra LeoneSingaporeSloveniaSmall statesSolomon IslandsSomaliaSouth AfricaSouth AsiaSouth Asia (IDA & IBRD)South SudanSri LankaSt. Kitts and NevisSt. LuciaSt. Vincent and the GrenadinesSub-Saharan Africa Sub-Saharan Africa (excluding high income)Sub-Saharan Africa (IDA & IBRD countries)SudanSurinameSwazilandSyrian Arab RepublicTajikistanTanzaniaThailandTimor-LesteTogoTongaTrinidad and TobagoTunisiaTurkeyTurkmenistanTurks and Caicos IslandsTuvaluUgandaUkraineUnited Arab EmiratesUpper middle incomeUruguayUzbekistanVanuatuVenezuela, RBVietnamWest Bank and GazaWorldYemen, Rep.ZambiaZimbabwe La ligne de temps
Cette échelle de temps montre un graphique de 1961 année à 2015 année Morocco. Les données jusqu'à 1960 année ne sont pas présentés. Quantité d'observations actuelles selon dates: 55.
Source (désignation):
Les indicateurs du développement mondiale
Source (organisation):
Development Assistance Committee of the Organisation for Economic Co-operation and Development, Geographical Distribution of Financial Flows to Developing Countries, Development Co-operation Report, and International Development Statistics database. Data are available online at: www.oecd.org/dac/stats/idsonline. World Bank population estimates are used for the denominator.
Catégories:
Aid Effectiveness, Economy & Growth, External Debt
Dernière mise à jour
23 avr. 2017
Les indicateurs de changement de valeurs selon les années
Minimum:
4.153
1 janv. 1968
Maximum:
66.243
1 janv. 2015
Pour la date d''observation
Valeur
Changement absolu
Le changement par rapport à la valeur précédente
1 janv. 1961
4.851
+4.851
0.0%
1 janv. 1962
8.757
+3.907
80.54%
1 janv. 1963
6.09
-2.667
-30.45%
1 janv. 1964
7.007
+0.916
15.04%
1 janv. 1965
7.308
+0.302
4.3%
1 janv. 1966
7.482
+0.174
2.38%
1 janv. 1967
6.719
-0.763
-10.2%
1 janv. 1968
4.153
-2.566
-38.19%
1 janv. 1969
6.044
+1.891
45.53%
1 janv. 1970
4.948
-1.096
-18.13%
1 janv. 1971
5.334
+0.386
7.8%
1 janv. 1972
8.085
+2.751
51.57%
1 janv. 1973
6.06
-2.025
-25.05%
1 janv. 1974
5.507
-0.553
-9.12%
1 janv. 1975
6.57
+1.062
19.29%
1 janv. 1976
15.128
+8.559
130.27%
1 janv. 1977
13.772
-1.356
-8.97%
1 janv. 1978
32.409
+18.637
135.33%
1 janv. 1979
22.414
-9.995
-30.84%
1 janv. 1980
27.424
+5.01
22.35%
1 janv. 1981
57.834
+30.41
110.89%
1 janv. 1982
50.772
-7.062
-12.21%
1 janv. 1983
40.366
-10.406
-20.5%
1 janv. 1984
20.7
-19.666
-48.72%
1 janv. 1985
15.378
-5.322
-25.71%
1 janv. 1986
38.319
+22.941
149.18%
1 janv. 1987
18.531
-19.788
-51.64%
1 janv. 1988
18.072
-0.459
-2.48%
1 janv. 1989
20.113
+2.041
11.29%
1 janv. 1990
20.381
+0.268
1.33%
1 janv. 1991
49.743
+29.362
144.06%
1 janv. 1992
60.317
+10.574
21.26%
1 janv. 1993
36.866
-23.451
-38.88%
1 janv. 1994
29.642
-7.225
-19.6%
1 janv. 1995
25.554
-4.087
-13.79%
1 janv. 1996
18.429
-7.126
-27.88%
1 janv. 1997
23.573
+5.144
27.91%
1 janv. 1998
16.879
-6.694
-28.4%
1 janv. 1999
18.773
+1.894
11.22%
1 janv. 2000
23.737
+4.963
26.44%
1 janv. 2001
15.005
-8.731
-36.78%
1 janv. 2002
16.468
+1.463
9.75%
1 janv. 2003
11.937
-4.531
-27.51%
1 janv. 2004
19.212
+7.274
60.94%
1 janv. 2005
25.588
+6.377
33.19%
1 janv. 2006
24.101
-1.487
-5.81%
1 janv. 2007
35.912
+11.811
49.0%
1 janv. 2008
39.383
+3.471
9.67%
1 janv. 2009
46.289
+6.906
17.53%
1 janv. 2010
33.019
-13.269
-28.67%
1 janv. 2011
30.834
-2.185
-6.62%
1 janv. 2012
44.102
+13.268
43.03%
1 janv. 2013
44.429
+0.327
0.74%
1 janv. 2014
59.907
+15.478
34.84%
1 janv. 2015
66.243
+6.336
10.58%
Classement des pays selon les statistiques actuelles par années


Commentaires: