29
/fr/
fr
AIzaSyAYiBZKx7MnpbEhh9jyipgxe19OcubqV5w
April 1, 2024
125203
Egypt, Arab Rep.
EGY
true
2
1
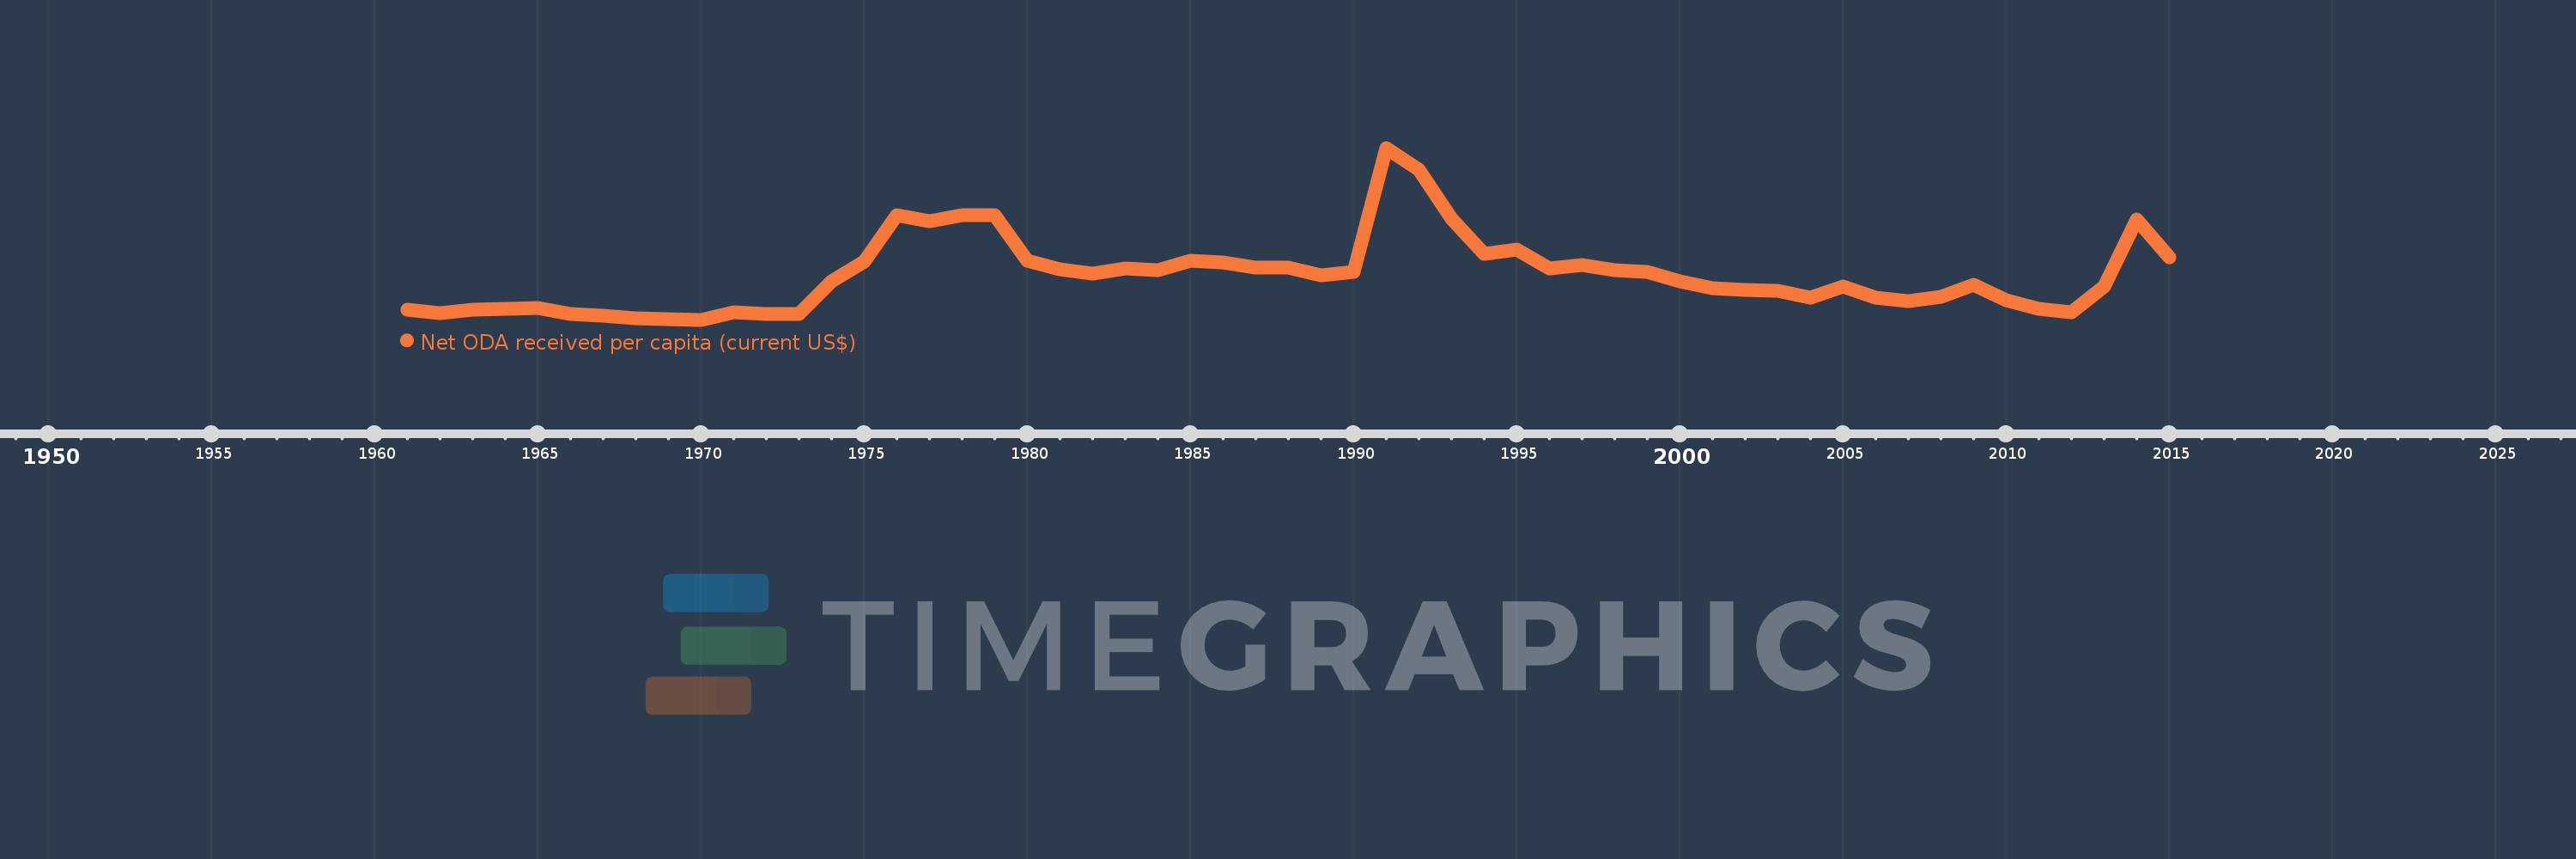
Net ODA received per capita (current US$)
2015,2014,2013,2012,2011,2010,2009,2008,2007,2006,2005,2004,2003,2002,2001,2000,1999,1998,1997,1996,1995,1994,1993,1992,1991,1990,1989,1988,1987,1986,1985,1984,1983,1982,1981,1980,1979,1978,1977,1976,1975,1974,1973,1972,1971,1970,1969,1968,1967,1966,1965,1964,1963,1962,1961
Cette statistique dans les autres pays:
AfghanistanAlbaniaAlgeriaAngolaAntigua and BarbudaArab WorldArgentinaArmeniaArubaAzerbaijanBahamas, TheBahrainBangladeshBarbadosBelarusBelizeBeninBermudaBhutanBoliviaBosnia and HerzegovinaBotswanaBrazilBritish Virgin IslandsBrunei DarussalamBurkina FasoBurundiCabo VerdeCambodiaCameroonCaribbean small statesCayman IslandsCentral African RepublicCentral Europe and the BalticsChadChileChinaColombiaComorosCongo, Dem. Rep.Congo, Rep.Costa RicaCote d'IvoireCroatiaCubaCyprusDjiboutiDominicaDominican RepublicEast Asia & PacificEast Asia & Pacific (excluding high income)East Asia & Pacific (IDA & IBRD countries)EcuadorEgypt, Arab Rep.El SalvadorEquatorial GuineaEritreaEthiopiaEuro areaEurope & Central AsiaEurope & Central Asia (excluding high income)Europe & Central Asia (IDA & IBRD countries)European UnionFijiFragile and conflict affected situationsFrench PolynesiaGabonGambia, TheGeorgiaGhanaGibraltarGrenadaGuatemalaGuineaGuinea-BissauGuyanaHaitiHeavily indebted poor countries (HIPC)High incomeHondurasHong Kong SAR, ChinaIBRD onlyIDA & IBRD totalIDA blendIDA onlyIDA totalIndiaIndonesiaIran, Islamic Rep.IraqIsraelJamaicaJordanKazakhstanKenyaKiribatiKorea, Dem. People’s Rep.Korea, Rep.KosovoKuwaitKyrgyz RepublicLao PDRLatin America & Caribbean Latin America & Caribbean (excluding high income)Latin America & the Caribbean (IDA & IBRD countries)Least developed countries: UN classificationLebanonLesothoLiberiaLibyaLow & middle incomeLow incomeLower middle incomeMacao SAR, ChinaMacedonia, FYRMadagascarMalawiMalaysiaMaldivesMaliMaltaMarshall IslandsMauritaniaMauritiusMexicoMicronesia, Fed. Sts.Middle East & North AfricaMiddle East & North Africa (excluding high income)Middle East & North Africa (IDA & IBRD countries)Middle incomeMoldovaMongoliaMontenegroMoroccoMozambiqueMyanmarNamibiaNauruNepalNew CaledoniaNicaraguaNigerNigeriaNorth AmericaNorthern Mariana IslandsOECD membersOmanOther small statesPacific island small statesPakistanPalauPanamaPapua New GuineaParaguayPeruPhilippinesQatarRwandaSamoaSao Tome and PrincipeSaudi ArabiaSenegalSerbiaSeychellesSierra LeoneSingaporeSloveniaSmall statesSolomon IslandsSomaliaSouth AfricaSouth AsiaSouth Asia (IDA & IBRD)South SudanSri LankaSt. Kitts and NevisSt. LuciaSt. Vincent and the GrenadinesSub-Saharan Africa Sub-Saharan Africa (excluding high income)Sub-Saharan Africa (IDA & IBRD countries)SudanSurinameSwazilandSyrian Arab RepublicTajikistanTanzaniaThailandTimor-LesteTogoTongaTrinidad and TobagoTunisiaTurkeyTurkmenistanTurks and Caicos IslandsTuvaluUgandaUkraineUnited Arab EmiratesUpper middle incomeUruguayUzbekistanVanuatuVenezuela, RBVietnamWest Bank and GazaWorldYemen, Rep.ZambiaZimbabwe La ligne de temps
Cette échelle de temps montre un graphique de 1961 année à 2015 année Egypt, Arab Rep.. Les données jusqu'à 1960 année ne sont pas présentés. Quantité d'observations actuelles selon dates: 55.
Source (désignation):
Les indicateurs du développement mondiale
Source (organisation):
Development Assistance Committee of the Organisation for Economic Co-operation and Development, Geographical Distribution of Financial Flows to Developing Countries, Development Co-operation Report, and International Development Statistics database. Data are available online at: www.oecd.org/dac/stats/idsonline. World Bank population estimates are used for the denominator.
Catégories:
Aid Effectiveness, Economy & Growth, External Debt
Dernière mise à jour
23 avr. 2017
Les indicateurs de changement de valeurs selon les années
Minimum:
0.291
1 janv. 1970
Maximum:
107.398
1 janv. 1991
Pour la date d''observation
Valeur
Changement absolu
Le changement par rapport à la valeur précédente
1 janv. 1961
6.59
+6.59
0.0%
1 janv. 1962
4.235
-2.355
-35.74%
1 janv. 1963
6.584
+2.349
55.47%
1 janv. 1964
7.062
+0.479
7.27%
1 janv. 1965
7.819
+0.756
10.71%
1 janv. 1966
3.976
-3.843
-49.14%
1 janv. 1967
3.071
-0.905
-22.76%
1 janv. 1968
1.017
-2.055
-66.9%
1 janv. 1969
0.773
-0.244
-23.98%
1 janv. 1970
0.291
-0.482
-62.37%
1 janv. 1971
4.911
+4.62
1.59 milles%
1 janv. 1972
3.901
-1.01
-20.57%
1 janv. 1973
3.855
-0.046
-1.17%
1 janv. 1974
24.183
+20.329
527.35%
1 janv. 1975
36.633
+12.449
51.48%
1 janv. 1976
65.264
+28.631
78.16%
1 janv. 1977
61.853
-3.41
-5.23%
1 janv. 1978
65.585
+3.732
6.03%
1 janv. 1979
65.44
-0.145
-0.22%
1 janv. 1980
37.294
-28.146
-43.01%
1 janv. 1981
31.967
-5.327
-14.28%
1 janv. 1982
29.136
-2.831
-8.85%
1 janv. 1983
32.105
+2.969
10.19%
1 janv. 1984
31.049
-1.055
-3.29%
1 janv. 1985
36.836
+5.787
18.64%
1 janv. 1986
36.108
-0.728
-1.98%
1 janv. 1987
32.944
-3.164
-8.76%
1 janv. 1988
33.038
+0.094
0.29%
1 janv. 1989
28.056
-4.982
-15.08%
1 janv. 1990
29.859
+1.803
6.43%
1 janv. 1991
107.398
+77.538
259.68%
1 janv. 1992
93.787
-13.611
-12.67%
1 janv. 1993
63.515
-30.272
-32.28%
1 janv. 1994
41.374
-22.141
-34.86%
1 janv. 1995
43.982
+2.609
6.3%
1 janv. 1996
32.512
-11.47
-26.08%
1 janv. 1997
34.499
+1.986
6.11%
1 janv. 1998
31.138
-3.361
-9.74%
1 janv. 1999
29.889
-1.249
-4.01%
1 janv. 2000
24.213
-5.675
-18.99%
1 janv. 2001
20.065
-4.148
-17.13%
1 janv. 2002
18.796
-1.269
-6.32%
1 janv. 2003
18.591
-0.205
-1.09%
1 janv. 2004
14.123
-4.468
-24.03%
1 janv. 2005
21.147
+7.025
49.74%
1 janv. 2006
13.83
-7.317
-34.6%
1 janv. 2007
11.783
-2.047
-14.8%
1 janv. 2008
14.597
+2.814
23.88%
1 janv. 2009
22.061
+7.465
51.14%
1 janv. 2010
12.432
-9.63
-43.65%
1 janv. 2011
7.181
-5.251
-42.24%
1 janv. 2012
4.97
-2.211
-30.79%
1 janv. 2013
21.092
+16.122
324.39%
1 janv. 2014
62.869
+41.777
198.07%
1 janv. 2015
39.43
-23.438
-37.28%
Classement des pays selon les statistiques actuelles par années


Commentaires: