29
/fr/
fr
AIzaSyAYiBZKx7MnpbEhh9jyipgxe19OcubqV5w
April 1, 2024
165236
Jordan
JOR
true
2
1
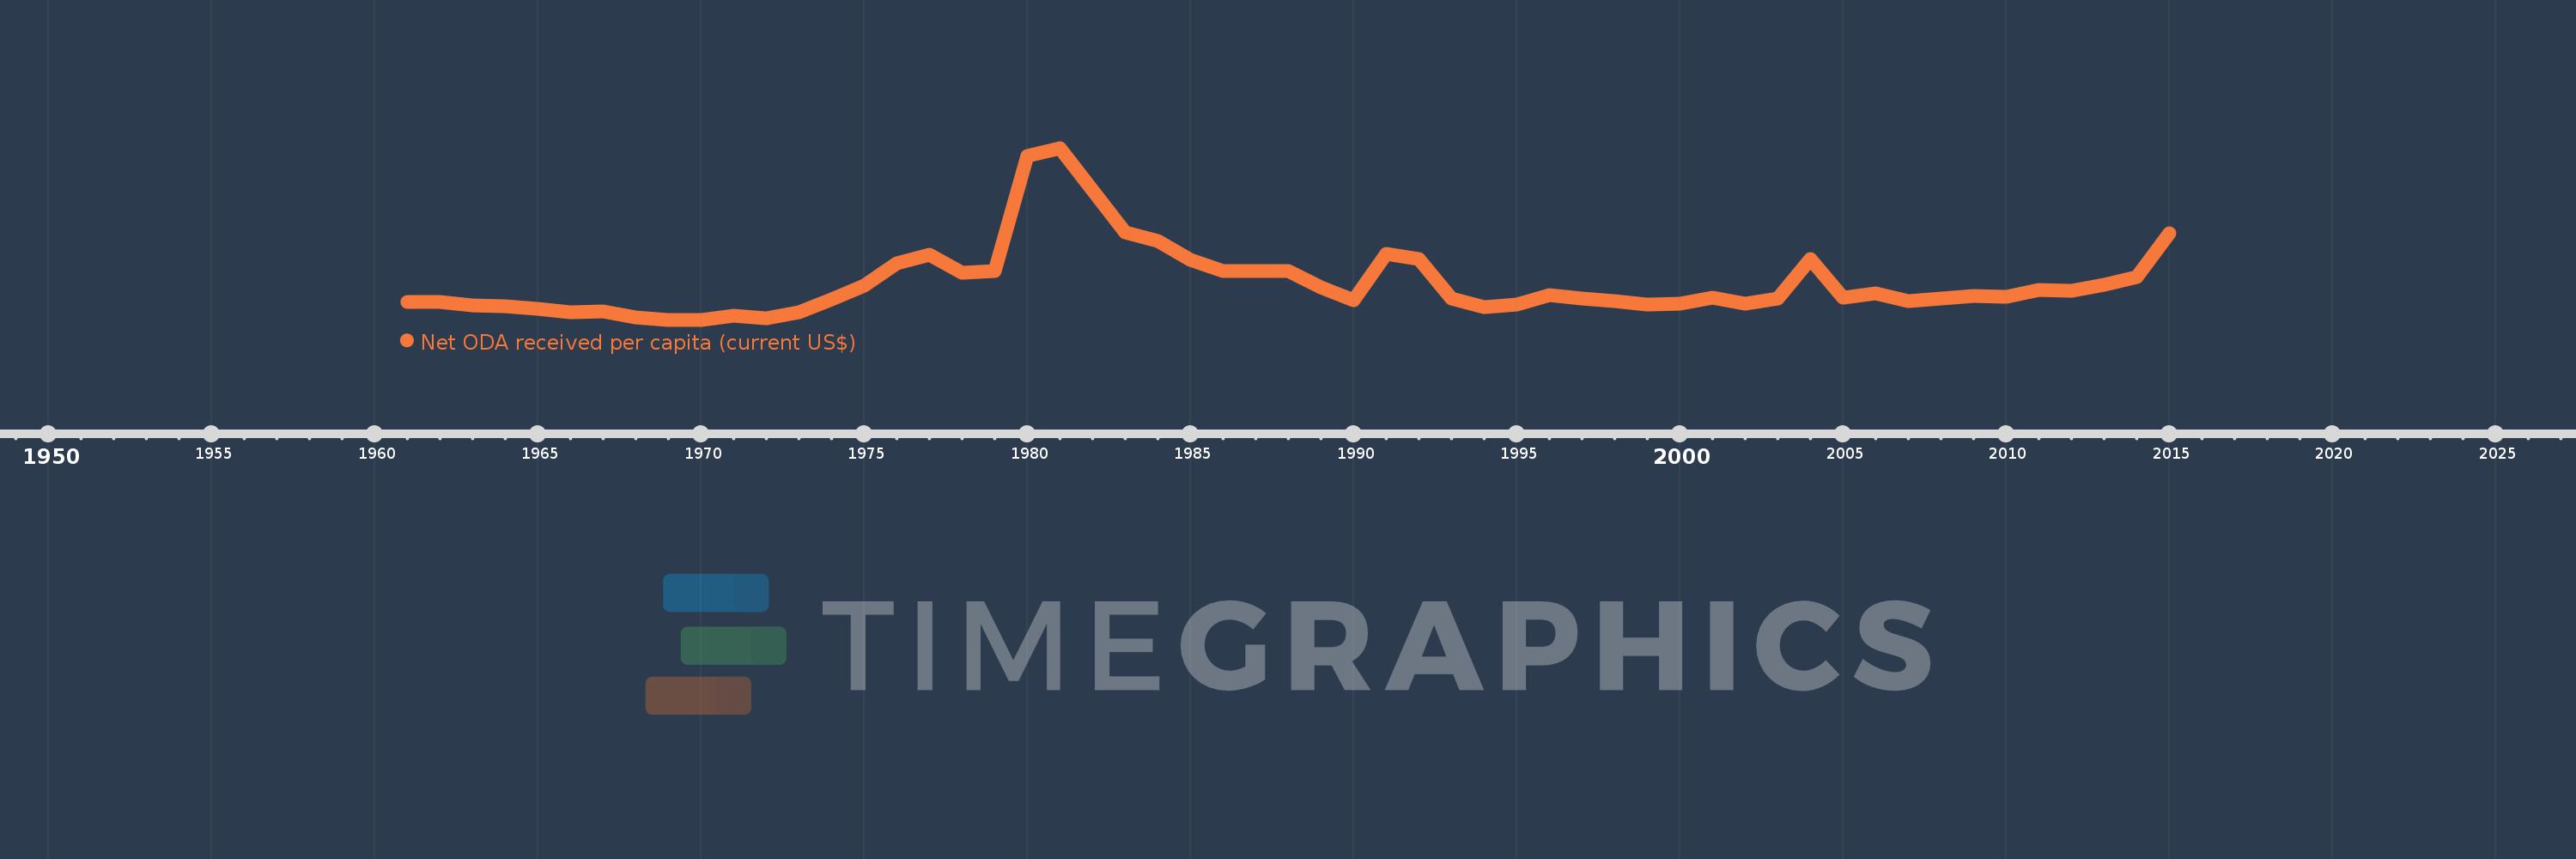
Net ODA received per capita (current US$)
2015,2014,2013,2012,2011,2010,2009,2008,2007,2006,2005,2004,2003,2002,2001,2000,1999,1998,1997,1996,1995,1994,1993,1992,1991,1990,1989,1988,1987,1986,1985,1984,1983,1982,1981,1980,1979,1978,1977,1976,1975,1974,1973,1972,1971,1970,1969,1968,1967,1966,1965,1964,1963,1962,1961
Cette statistique dans les autres pays:
AfghanistanAlbaniaAlgeriaAngolaAntigua and BarbudaArab WorldArgentinaArmeniaArubaAzerbaijanBahamas, TheBahrainBangladeshBarbadosBelarusBelizeBeninBermudaBhutanBoliviaBosnia and HerzegovinaBotswanaBrazilBritish Virgin IslandsBrunei DarussalamBurkina FasoBurundiCabo VerdeCambodiaCameroonCaribbean small statesCayman IslandsCentral African RepublicCentral Europe and the BalticsChadChileChinaColombiaComorosCongo, Dem. Rep.Congo, Rep.Costa RicaCote d'IvoireCroatiaCubaCyprusDjiboutiDominicaDominican RepublicEast Asia & PacificEast Asia & Pacific (excluding high income)East Asia & Pacific (IDA & IBRD countries)EcuadorEgypt, Arab Rep.El SalvadorEquatorial GuineaEritreaEthiopiaEuro areaEurope & Central AsiaEurope & Central Asia (excluding high income)Europe & Central Asia (IDA & IBRD countries)European UnionFijiFragile and conflict affected situationsFrench PolynesiaGabonGambia, TheGeorgiaGhanaGibraltarGrenadaGuatemalaGuineaGuinea-BissauGuyanaHaitiHeavily indebted poor countries (HIPC)High incomeHondurasHong Kong SAR, ChinaIBRD onlyIDA & IBRD totalIDA blendIDA onlyIDA totalIndiaIndonesiaIran, Islamic Rep.IraqIsraelJamaicaJordanKazakhstanKenyaKiribatiKorea, Dem. People’s Rep.Korea, Rep.KosovoKuwaitKyrgyz RepublicLao PDRLatin America & Caribbean Latin America & Caribbean (excluding high income)Latin America & the Caribbean (IDA & IBRD countries)Least developed countries: UN classificationLebanonLesothoLiberiaLibyaLow & middle incomeLow incomeLower middle incomeMacao SAR, ChinaMacedonia, FYRMadagascarMalawiMalaysiaMaldivesMaliMaltaMarshall IslandsMauritaniaMauritiusMexicoMicronesia, Fed. Sts.Middle East & North AfricaMiddle East & North Africa (excluding high income)Middle East & North Africa (IDA & IBRD countries)Middle incomeMoldovaMongoliaMontenegroMoroccoMozambiqueMyanmarNamibiaNauruNepalNew CaledoniaNicaraguaNigerNigeriaNorth AmericaNorthern Mariana IslandsOECD membersOmanOther small statesPacific island small statesPakistanPalauPanamaPapua New GuineaParaguayPeruPhilippinesQatarRwandaSamoaSao Tome and PrincipeSaudi ArabiaSenegalSerbiaSeychellesSierra LeoneSingaporeSloveniaSmall statesSolomon IslandsSomaliaSouth AfricaSouth AsiaSouth Asia (IDA & IBRD)South SudanSri LankaSt. Kitts and NevisSt. LuciaSt. Vincent and the GrenadinesSub-Saharan Africa Sub-Saharan Africa (excluding high income)Sub-Saharan Africa (IDA & IBRD countries)SudanSurinameSwazilandSyrian Arab RepublicTajikistanTanzaniaThailandTimor-LesteTogoTongaTrinidad and TobagoTunisiaTurkeyTurkmenistanTurks and Caicos IslandsTuvaluUgandaUkraineUnited Arab EmiratesUpper middle incomeUruguayUzbekistanVanuatuVenezuela, RBVietnamWest Bank and GazaWorldYemen, Rep.ZambiaZimbabwe La ligne de temps
Cette échelle de temps montre un graphique de 1961 année à 2015 année Jordan. Les données jusqu'à 1960 année ne sont pas présentés. Quantité d'observations actuelles selon dates: 55.
Source (désignation):
Les indicateurs du développement mondiale
Source (organisation):
Development Assistance Committee of the Organisation for Economic Co-operation and Development, Geographical Distribution of Financial Flows to Developing Countries, Development Co-operation Report, and International Development Statistics database. Data are available online at: www.oecd.org/dac/stats/idsonline. World Bank population estimates are used for the denominator.
Catégories:
Aid Effectiveness, Economy & Growth, External Debt
Dernière mise à jour
23 avr. 2017
Les indicateurs de changement de valeurs selon les années
Minimum:
31.237
1 janv. 1970
Maximum:
691.082
1 janv. 1981
Pour la date d''observation
Valeur
Changement absolu
Le changement par rapport à la valeur précédente
1 janv. 1961
99.355
+99.355
0.0%
1 janv. 1962
98.928
-0.427
-0.43%
1 janv. 1963
84.889
-14.038
-14.19%
1 janv. 1964
82.608
-2.281
-2.69%
1 janv. 1965
71.903
-10.705
-12.96%
1 janv. 1966
61.574
-10.329
-14.37%
1 janv. 1967
63.52
+1.947
3.16%
1 janv. 1968
40.518
-23.003
-36.21%
1 janv. 1969
31.779
-8.738
-21.57%
1 janv. 1970
31.237
-0.542
-1.71%
1 janv. 1971
48.393
+17.156
54.92%
1 janv. 1972
36.962
-11.432
-23.62%
1 janv. 1973
60.319
+23.357
63.19%
1 janv. 1974
109.621
+49.302
81.74%
1 janv. 1975
161.363
+51.742
47.2%
1 janv. 1976
247.683
+86.32
53.49%
1 janv. 1977
281.102
+33.42
13.49%
1 janv. 1978
210.832
-70.271
-25.0%
1 janv. 1979
219.941
+9.11
4.32%
1 janv. 1980
661.648
+441.706
200.83%
1 janv. 1981
691.082
+29.434
4.45%
1 janv. 1982
527.966
-163.116
-23.6%
1 janv. 1983
367.037
-160.929
-30.48%
1 janv. 1984
332.545
-34.491
-9.4%
1 janv. 1985
262.042
-70.503
-21.2%
1 janv. 1986
218.27
-43.772
-16.7%
1 janv. 1987
219.454
+1.184
0.54%
1 janv. 1988
216.772
-2.682
-1.22%
1 janv. 1989
154.108
-62.664
-28.91%
1 janv. 1990
105.46
-48.648
-31.57%
1 janv. 1991
283.363
+177.903
168.69%
1 janv. 1992
265.442
-17.921
-6.32%
1 janv. 1993
113.589
-151.853
-57.21%
1 janv. 1994
78.232
-35.357
-31.13%
1 janv. 1995
89.667
+11.435
14.62%
1 janv. 1996
124.799
+35.132
39.18%
1 janv. 1997
113.958
-10.84
-8.69%
1 janv. 1998
103.968
-9.991
-8.77%
1 janv. 1999
89.249
-14.719
-14.16%
1 janv. 2000
92.454
+3.205
3.59%
1 janv. 2001
115.936
+23.481
25.4%
1 janv. 2002
92.66
-23.276
-20.08%
1 janv. 2003
114.023
+21.363
23.06%
1 janv. 2004
262.923
+148.901
130.59%
1 janv. 2005
116.6
-146.324
-55.65%
1 janv. 2006
132.843
+16.244
13.93%
1 janv. 2007
103.535
-29.308
-22.06%
1 janv. 2008
111.162
+7.627
7.37%
1 janv. 2009
122.778
+11.616
10.45%
1 janv. 2010
118.14
-4.638
-3.78%
1 janv. 2011
145.944
+27.804
23.53%
1 janv. 2012
143.628
-2.316
-1.59%
1 janv. 2013
165.458
+21.83
15.2%
1 janv. 2014
194.42
+28.962
17.5%
1 janv. 2015
363.948
+169.528
87.2%
Classement des pays selon les statistiques actuelles par années


Commentaires: