29
/fr/
fr
AIzaSyAYiBZKx7MnpbEhh9jyipgxe19OcubqV5w
April 1, 2024
130859
Ethiopia
ETH
true
2
1
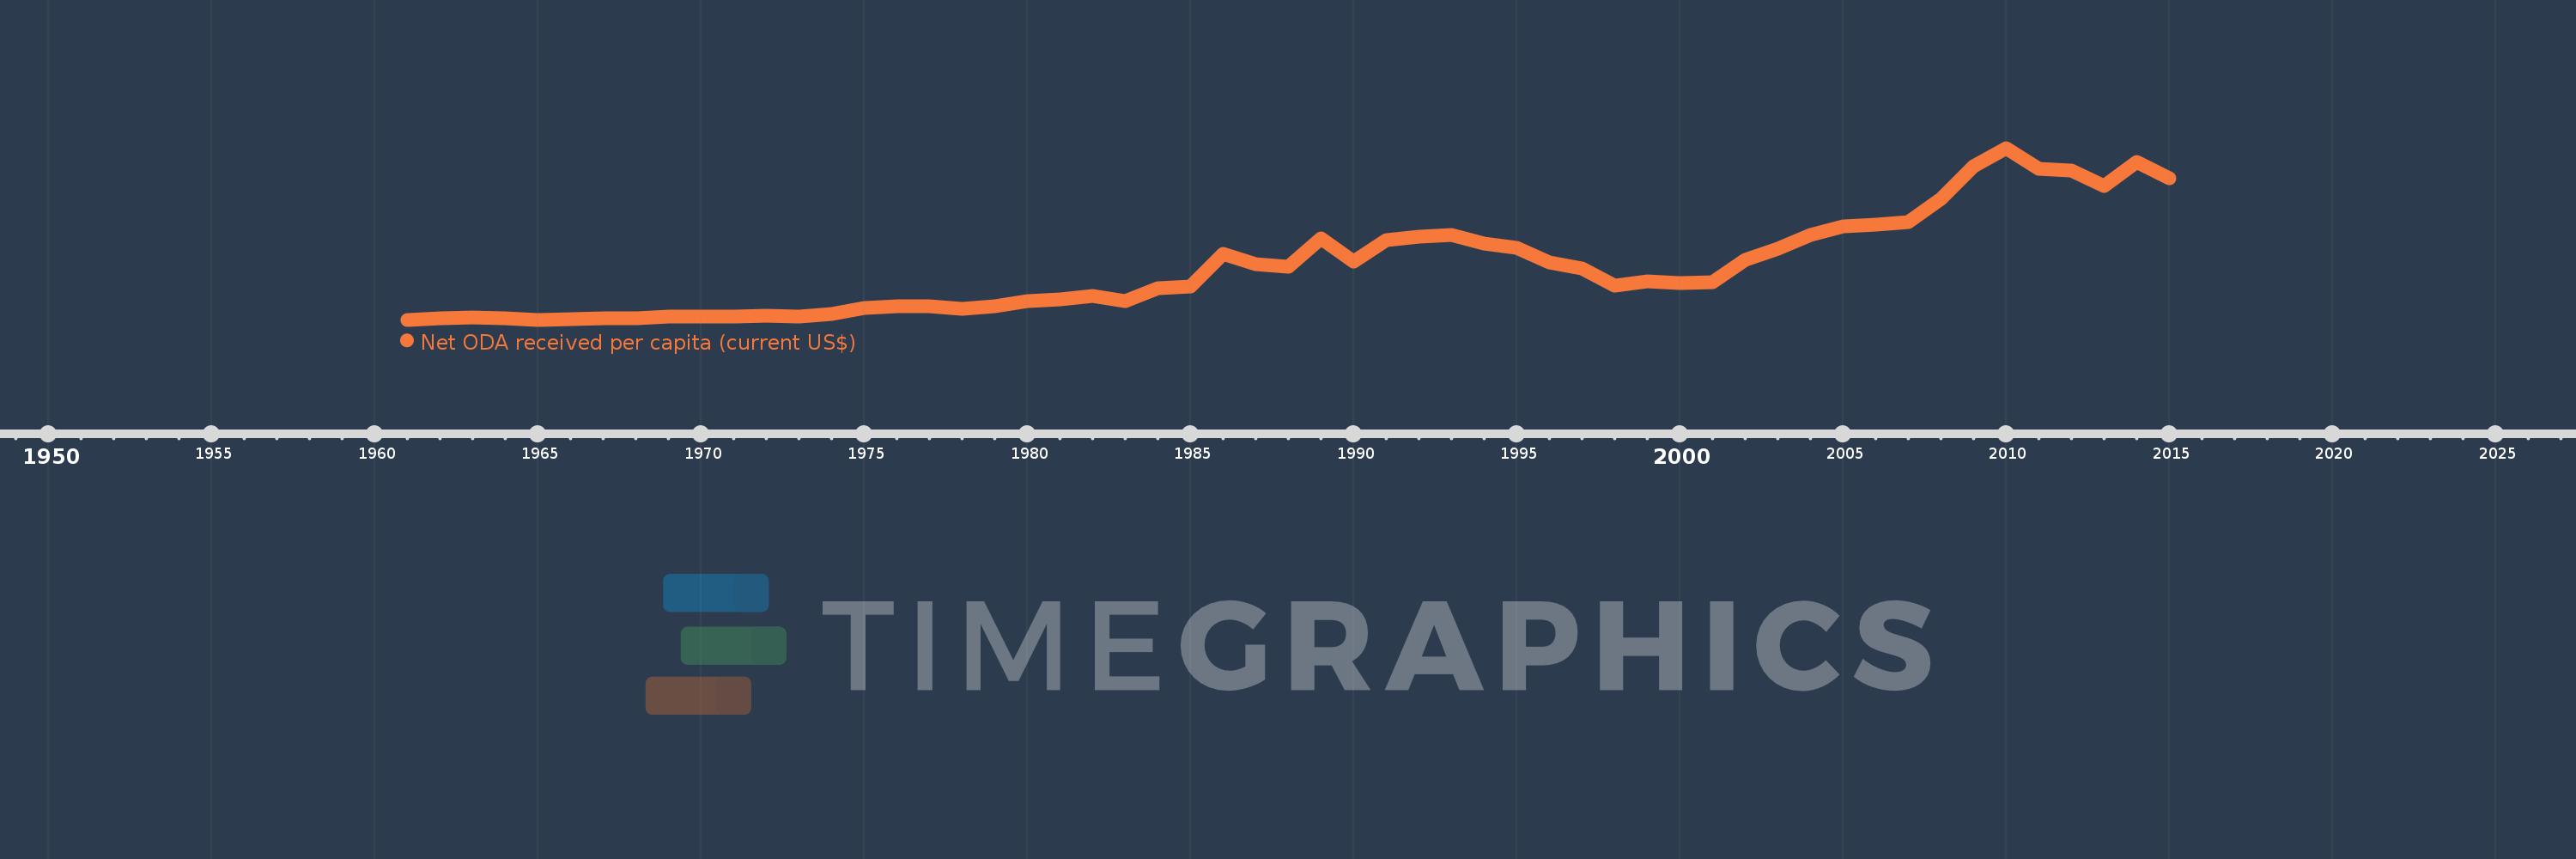
Net ODA received per capita (current US$)
2015,2014,2013,2012,2011,2010,2009,2008,2007,2006,2005,2004,2003,2002,2001,2000,1999,1998,1997,1996,1995,1994,1993,1992,1991,1990,1989,1988,1987,1986,1985,1984,1983,1982,1981,1980,1979,1978,1977,1976,1975,1974,1973,1972,1971,1970,1969,1968,1967,1966,1965,1964,1963,1962,1961
Cette statistique dans les autres pays:
AfghanistanAlbaniaAlgeriaAngolaAntigua and BarbudaArab WorldArgentinaArmeniaArubaAzerbaijanBahamas, TheBahrainBangladeshBarbadosBelarusBelizeBeninBermudaBhutanBoliviaBosnia and HerzegovinaBotswanaBrazilBritish Virgin IslandsBrunei DarussalamBurkina FasoBurundiCabo VerdeCambodiaCameroonCaribbean small statesCayman IslandsCentral African RepublicCentral Europe and the BalticsChadChileChinaColombiaComorosCongo, Dem. Rep.Congo, Rep.Costa RicaCote d'IvoireCroatiaCubaCyprusDjiboutiDominicaDominican RepublicEast Asia & PacificEast Asia & Pacific (excluding high income)East Asia & Pacific (IDA & IBRD countries)EcuadorEgypt, Arab Rep.El SalvadorEquatorial GuineaEritreaEthiopiaEuro areaEurope & Central AsiaEurope & Central Asia (excluding high income)Europe & Central Asia (IDA & IBRD countries)European UnionFijiFragile and conflict affected situationsFrench PolynesiaGabonGambia, TheGeorgiaGhanaGibraltarGrenadaGuatemalaGuineaGuinea-BissauGuyanaHaitiHeavily indebted poor countries (HIPC)High incomeHondurasHong Kong SAR, ChinaIBRD onlyIDA & IBRD totalIDA blendIDA onlyIDA totalIndiaIndonesiaIran, Islamic Rep.IraqIsraelJamaicaJordanKazakhstanKenyaKiribatiKorea, Dem. People’s Rep.Korea, Rep.KosovoKuwaitKyrgyz RepublicLao PDRLatin America & Caribbean Latin America & Caribbean (excluding high income)Latin America & the Caribbean (IDA & IBRD countries)Least developed countries: UN classificationLebanonLesothoLiberiaLibyaLow & middle incomeLow incomeLower middle incomeMacao SAR, ChinaMacedonia, FYRMadagascarMalawiMalaysiaMaldivesMaliMaltaMarshall IslandsMauritaniaMauritiusMexicoMicronesia, Fed. Sts.Middle East & North AfricaMiddle East & North Africa (excluding high income)Middle East & North Africa (IDA & IBRD countries)Middle incomeMoldovaMongoliaMontenegroMoroccoMozambiqueMyanmarNamibiaNauruNepalNew CaledoniaNicaraguaNigerNigeriaNorth AmericaNorthern Mariana IslandsOECD membersOmanOther small statesPacific island small statesPakistanPalauPanamaPapua New GuineaParaguayPeruPhilippinesQatarRwandaSamoaSao Tome and PrincipeSaudi ArabiaSenegalSerbiaSeychellesSierra LeoneSingaporeSloveniaSmall statesSolomon IslandsSomaliaSouth AfricaSouth AsiaSouth Asia (IDA & IBRD)South SudanSri LankaSt. Kitts and NevisSt. LuciaSt. Vincent and the GrenadinesSub-Saharan Africa Sub-Saharan Africa (excluding high income)Sub-Saharan Africa (IDA & IBRD countries)SudanSurinameSwazilandSyrian Arab RepublicTajikistanTanzaniaThailandTimor-LesteTogoTongaTrinidad and TobagoTunisiaTurkeyTurkmenistanTurks and Caicos IslandsTuvaluUgandaUkraineUnited Arab EmiratesUpper middle incomeUruguayUzbekistanVanuatuVenezuela, RBVietnamWest Bank and GazaWorldYemen, Rep.ZambiaZimbabwe La ligne de temps
Cette échelle de temps montre un graphique de 1961 année à 2015 année Ethiopia. Les données jusqu'à 1960 année ne sont pas présentés. Quantité d'observations actuelles selon dates: 55.
Source (désignation):
Les indicateurs du développement mondiale
Source (organisation):
Development Assistance Committee of the Organisation for Economic Co-operation and Development, Geographical Distribution of Financial Flows to Developing Countries, Development Co-operation Report, and International Development Statistics database. Data are available online at: www.oecd.org/dac/stats/idsonline. World Bank population estimates are used for the denominator.
Catégories:
Aid Effectiveness, Economy & Growth, External Debt
Dernière mise à jour
23 avr. 2017
Les indicateurs de changement de valeurs selon les années
Minimum:
0.655
1 janv. 1965
Maximum:
44.768
1 janv. 2010
Pour la date d''observation
Valeur
Changement absolu
Le changement par rapport à la valeur précédente
1 janv. 1961
0.693
+0.693
0.0%
1 janv. 1962
0.925
+0.232
33.42%
1 janv. 1963
1.16
+0.236
25.49%
1 janv. 1964
1.046
-0.114
-9.81%
1 janv. 1965
0.655
-0.391
-37.4%
1 janv. 1966
0.837
+0.182
27.75%
1 janv. 1967
0.991
+0.154
18.39%
1 janv. 1968
1.053
+0.063
6.32%
1 janv. 1969
1.572
+0.518
49.22%
1 janv. 1970
1.401
-0.171
-10.87%
1 janv. 1971
1.396
-0.004
-0.32%
1 janv. 1972
1.606
+0.21
15.03%
1 janv. 1973
1.57
-0.036
-2.25%
1 janv. 1974
2.136
+0.566
36.03%
1 janv. 1975
3.67
+1.534
71.8%
1 janv. 1976
4.051
+0.382
10.4%
1 janv. 1977
4.216
+0.165
4.07%
1 janv. 1978
3.424
-0.793
-18.8%
1 janv. 1979
4.091
+0.667
19.49%
1 janv. 1980
5.513
+1.422
34.75%
1 janv. 1981
5.99
+0.477
8.66%
1 janv. 1982
6.784
+0.793
13.25%
1 janv. 1983
5.371
-1.412
-20.82%
1 janv. 1984
8.838
+3.467
64.54%
1 janv. 1985
9.1
+0.262
2.97%
1 janv. 1986
17.618
+8.518
93.6%
1 janv. 1987
14.992
-2.627
-14.91%
1 janv. 1988
14.338
-0.654
-4.36%
1 janv. 1989
21.498
+7.16
49.94%
1 janv. 1990
15.674
-5.824
-27.09%
1 janv. 1991
21.001
+5.327
33.99%
1 janv. 1992
21.932
+0.931
4.43%
1 janv. 1993
22.528
+0.596
2.72%
1 janv. 1994
20.209
-2.319
-10.29%
1 janv. 1995
19.201
-1.008
-4.99%
1 janv. 1996
15.313
-3.888
-20.25%
1 janv. 1997
13.813
-1.5
-9.8%
1 janv. 1998
9.498
-4.315
-31.24%
1 janv. 1999
10.528
+1.03
10.84%
1 janv. 2000
9.963
-0.565
-5.36%
1 janv. 2001
10.343
+0.38
3.81%
1 janv. 2002
16.129
+5.786
55.95%
1 janv. 2003
18.815
+2.685
16.65%
1 janv. 2004
22.454
+3.64
19.35%
1 janv. 2005
24.54
+2.085
9.29%
1 janv. 2006
25.165
+0.625
2.55%
1 janv. 2007
25.828
+0.663
2.63%
1 janv. 2008
31.628
+5.8
22.46%
1 janv. 2009
40.066
+8.439
26.68%
1 janv. 2010
44.768
+4.702
11.74%
1 janv. 2011
39.429
-5.339
-11.93%
1 janv. 2012
38.871
-0.558
-1.42%
1 janv. 2013
34.934
-3.937
-10.13%
1 janv. 2014
41.084
+6.15
17.6%
1 janv. 2015
36.976
-4.109
-10.0%
Classement des pays selon les statistiques actuelles par années


Commentaires: