29
/fr/
fr
AIzaSyAYiBZKx7MnpbEhh9jyipgxe19OcubqV5w
April 1, 2024
36019
High income
HIC
false
2
1
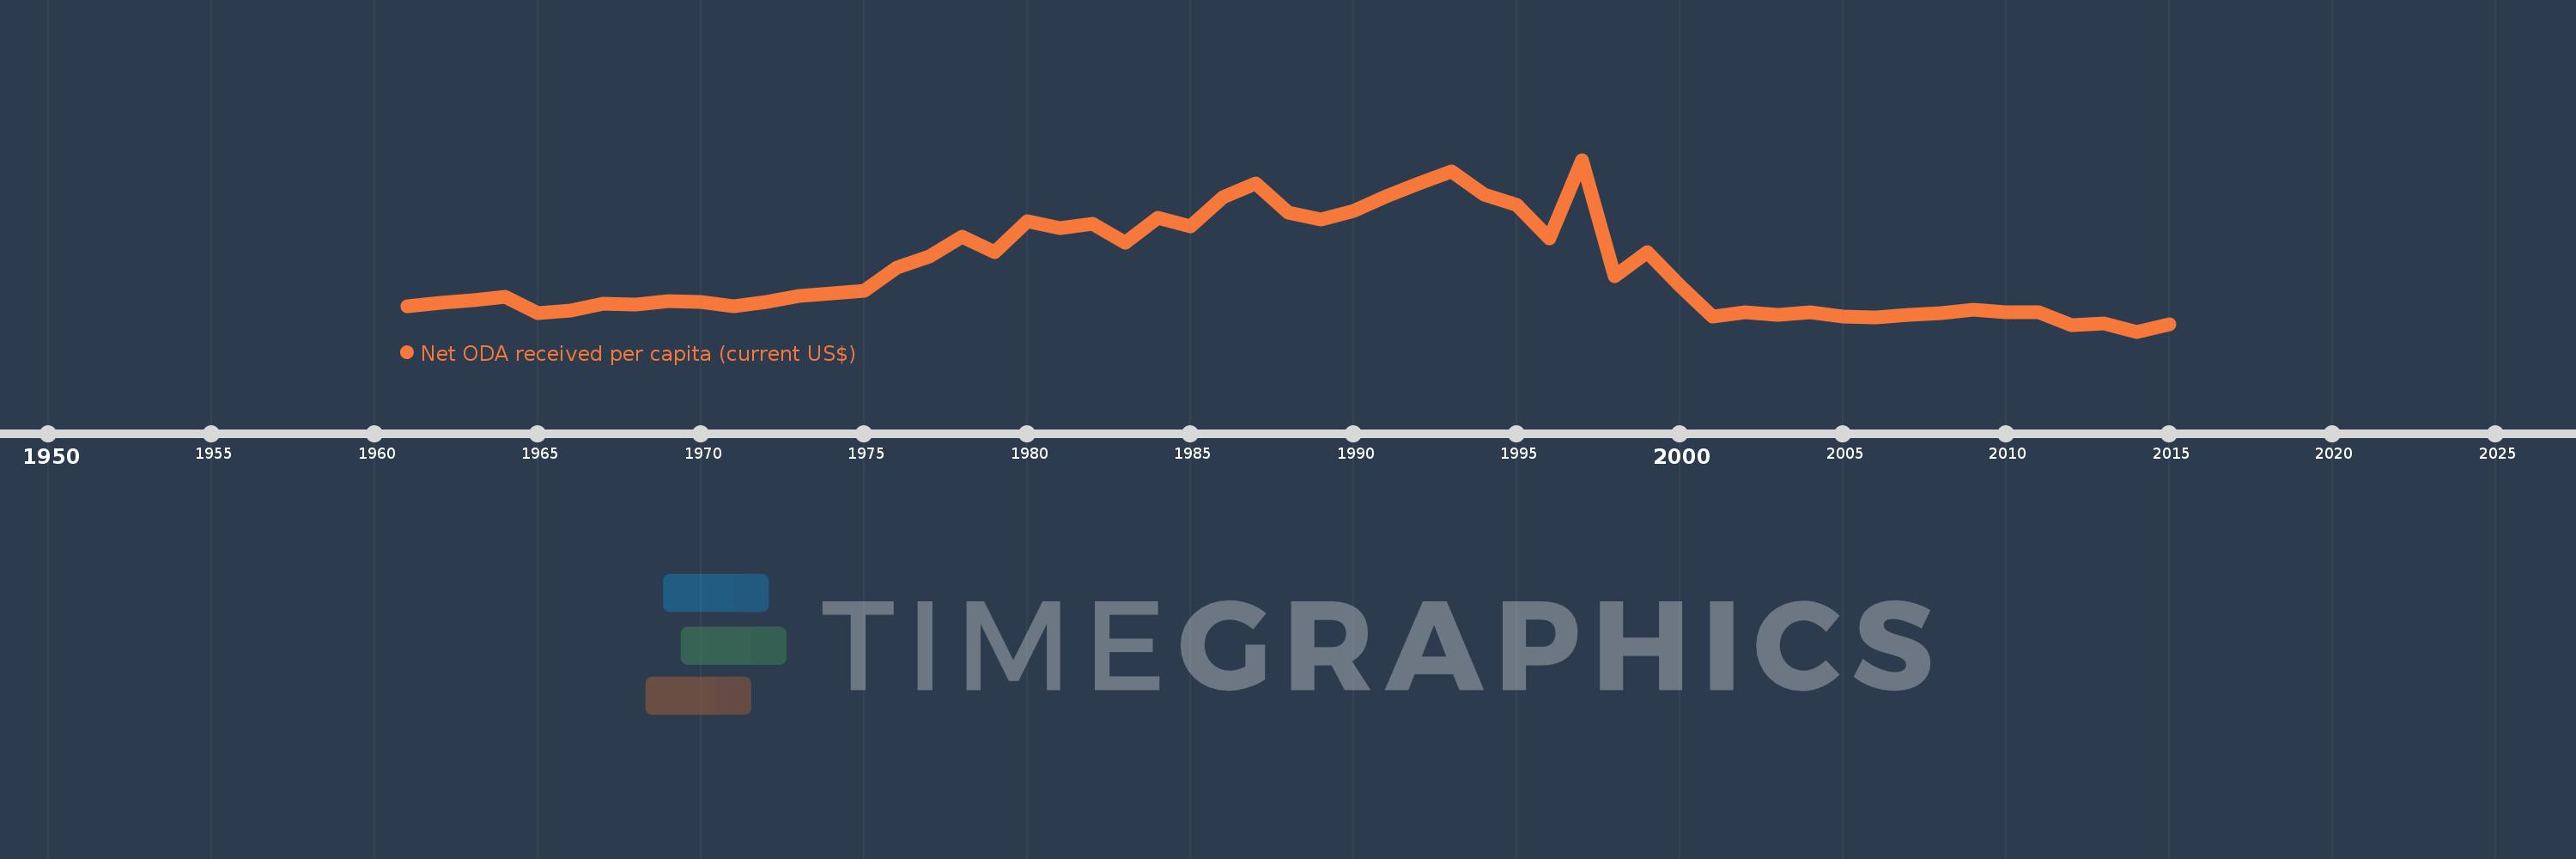
Net ODA received per capita (current US$)
2015,2014,2013,2012,2011,2010,2009,2008,2007,2006,2005,2004,2003,2002,2001,2000,1999,1998,1997,1996,1995,1994,1993,1992,1991,1990,1989,1988,1987,1986,1985,1984,1983,1982,1981,1980,1979,1978,1977,1976,1975,1974,1973,1972,1971,1970,1969,1968,1967,1966,1965,1964,1963,1962,1961
Cette statistique dans les autres pays:
AfghanistanAlbaniaAlgeriaAngolaAntigua and BarbudaArab WorldArgentinaArmeniaArubaAzerbaijanBahamas, TheBahrainBangladeshBarbadosBelarusBelizeBeninBermudaBhutanBoliviaBosnia and HerzegovinaBotswanaBrazilBritish Virgin IslandsBrunei DarussalamBurkina FasoBurundiCabo VerdeCambodiaCameroonCaribbean small statesCayman IslandsCentral African RepublicCentral Europe and the BalticsChadChileChinaColombiaComorosCongo, Dem. Rep.Congo, Rep.Costa RicaCote d'IvoireCroatiaCubaCyprusDjiboutiDominicaDominican RepublicEast Asia & PacificEast Asia & Pacific (excluding high income)East Asia & Pacific (IDA & IBRD countries)EcuadorEgypt, Arab Rep.El SalvadorEquatorial GuineaEritreaEthiopiaEuro areaEurope & Central AsiaEurope & Central Asia (excluding high income)Europe & Central Asia (IDA & IBRD countries)European UnionFijiFragile and conflict affected situationsFrench PolynesiaGabonGambia, TheGeorgiaGhanaGibraltarGrenadaGuatemalaGuineaGuinea-BissauGuyanaHaitiHeavily indebted poor countries (HIPC)High incomeHondurasHong Kong SAR, ChinaIBRD onlyIDA & IBRD totalIDA blendIDA onlyIDA totalIndiaIndonesiaIran, Islamic Rep.IraqIsraelJamaicaJordanKazakhstanKenyaKiribatiKorea, Dem. People’s Rep.Korea, Rep.KosovoKuwaitKyrgyz RepublicLao PDRLatin America & Caribbean Latin America & Caribbean (excluding high income)Latin America & the Caribbean (IDA & IBRD countries)Least developed countries: UN classificationLebanonLesothoLiberiaLibyaLow & middle incomeLow incomeLower middle incomeMacao SAR, ChinaMacedonia, FYRMadagascarMalawiMalaysiaMaldivesMaliMaltaMarshall IslandsMauritaniaMauritiusMexicoMicronesia, Fed. Sts.Middle East & North AfricaMiddle East & North Africa (excluding high income)Middle East & North Africa (IDA & IBRD countries)Middle incomeMoldovaMongoliaMontenegroMoroccoMozambiqueMyanmarNamibiaNauruNepalNew CaledoniaNicaraguaNigerNigeriaNorth AmericaNorthern Mariana IslandsOECD membersOmanOther small statesPacific island small statesPakistanPalauPanamaPapua New GuineaParaguayPeruPhilippinesQatarRwandaSamoaSao Tome and PrincipeSaudi ArabiaSenegalSerbiaSeychellesSierra LeoneSingaporeSloveniaSmall statesSolomon IslandsSomaliaSouth AfricaSouth AsiaSouth Asia (IDA & IBRD)South SudanSri LankaSt. Kitts and NevisSt. LuciaSt. Vincent and the GrenadinesSub-Saharan Africa Sub-Saharan Africa (excluding high income)Sub-Saharan Africa (IDA & IBRD countries)SudanSurinameSwazilandSyrian Arab RepublicTajikistanTanzaniaThailandTimor-LesteTogoTongaTrinidad and TobagoTunisiaTurkeyTurkmenistanTurks and Caicos IslandsTuvaluUgandaUkraineUnited Arab EmiratesUpper middle incomeUruguayUzbekistanVanuatuVenezuela, RBVietnamWest Bank and GazaWorldYemen, Rep.ZambiaZimbabwe La ligne de temps
Cette échelle de temps montre un graphique de 1961 année à 2015 année High income. Les données jusqu'à 1960 année ne sont pas présentés. Quantité d'observations actuelles selon dates: 55.
Source (désignation):
Les indicateurs du développement mondiale
Source (organisation):
Development Assistance Committee of the Organisation for Economic Co-operation and Development, Geographical Distribution of Financial Flows to Developing Countries, Development Co-operation Report, and International Development Statistics database. Data are available online at: www.oecd.org/dac/stats/idsonline. World Bank population estimates are used for the denominator.
Catégories:
Aid Effectiveness, Economy & Growth, External Debt
Dernière mise à jour
23 avr. 2017
Les indicateurs de changement de valeurs selon les années
Minimum:
0.214
1 janv. 2014
Maximum:
3.873
1 janv. 1997
Pour la date d''observation
Valeur
Changement absolu
Le changement par rapport à la valeur précédente
1 janv. 1961
0.751
+0.751
0.0%
1 janv. 1962
0.827
+0.077
10.2%
1 janv. 1963
0.887
+0.06
7.26%
1 janv. 1964
0.96
+0.072
8.13%
1 janv. 1965
0.61
-0.349
-36.41%
1 janv. 1966
0.654
+0.044
7.14%
1 janv. 1967
0.811
+0.157
24.04%
1 janv. 1968
0.783
-0.028
-3.44%
1 janv. 1969
0.859
+0.076
9.75%
1 janv. 1970
0.849
-0.01
-1.16%
1 janv. 1971
0.761
-0.088
-10.4%
1 janv. 1972
0.85
+0.089
11.65%
1 janv. 1973
0.971
+0.121
14.3%
1 janv. 1974
1.032
+0.061
6.29%
1 janv. 1975
1.082
+0.05
4.83%
1 janv. 1976
1.581
+0.499
46.1%
1 janv. 1977
1.807
+0.226
14.29%
1 janv. 1978
2.241
+0.434
24.01%
1 janv. 1979
1.914
-0.327
-14.59%
1 janv. 1980
2.566
+0.652
34.07%
1 janv. 1981
2.413
-0.152
-5.94%
1 janv. 1982
2.507
+0.093
3.86%
1 janv. 1983
2.104
-0.402
-16.05%
1 janv. 1984
2.636
+0.532
25.3%
1 janv. 1985
2.457
-0.18
-6.81%
1 janv. 1986
3.073
+0.616
25.06%
1 janv. 1987
3.377
+0.305
9.91%
1 janv. 1988
2.744
-0.634
-18.76%
1 janv. 1989
2.595
-0.149
-5.42%
1 janv. 1990
2.79
+0.195
7.53%
1 janv. 1991
3.089
+0.299
10.72%
1 janv. 1992
3.368
+0.279
9.04%
1 janv. 1993
3.632
+0.264
7.83%
1 janv. 1994
3.139
-0.493
-13.57%
1 janv. 1995
2.908
-0.231
-7.37%
1 janv. 1996
2.202
-0.706
-24.28%
1 janv. 1997
3.873
+1.671
75.89%
1 janv. 1998
1.391
-2.482
-64.08%
1 janv. 1999
1.91
+0.518
37.25%
1 janv. 2000
1.189
-0.72
-37.72%
1 janv. 2001
0.532
-0.658
-55.3%
1 janv. 2002
0.625
+0.094
17.59%
1 janv. 2003
0.575
-0.051
-8.1%
1 janv. 2004
0.627
+0.053
9.2%
1 janv. 2005
0.537
-0.091
-14.47%
1 janv. 2006
0.509
-0.027
-5.08%
1 janv. 2007
0.577
+0.068
13.32%
1 janv. 2008
0.601
+0.024
4.18%
1 janv. 2009
0.674
+0.072
12.04%
1 janv. 2010
0.628
-0.046
-6.77%
1 janv. 2011
0.63
+0.002
0.36%
1 janv. 2012
0.344
-0.286
-45.36%
1 janv. 2013
0.387
+0.042
12.25%
1 janv. 2014
0.214
-0.173
-44.66%
1 janv. 2015
0.365
+0.152
70.83%
Classement des pays selon les statistiques actuelles par années


Commentaires: