29
/fr/
fr
AIzaSyAYiBZKx7MnpbEhh9jyipgxe19OcubqV5w
April 1, 2024
282679
Vietnam
VNM
true
2
1
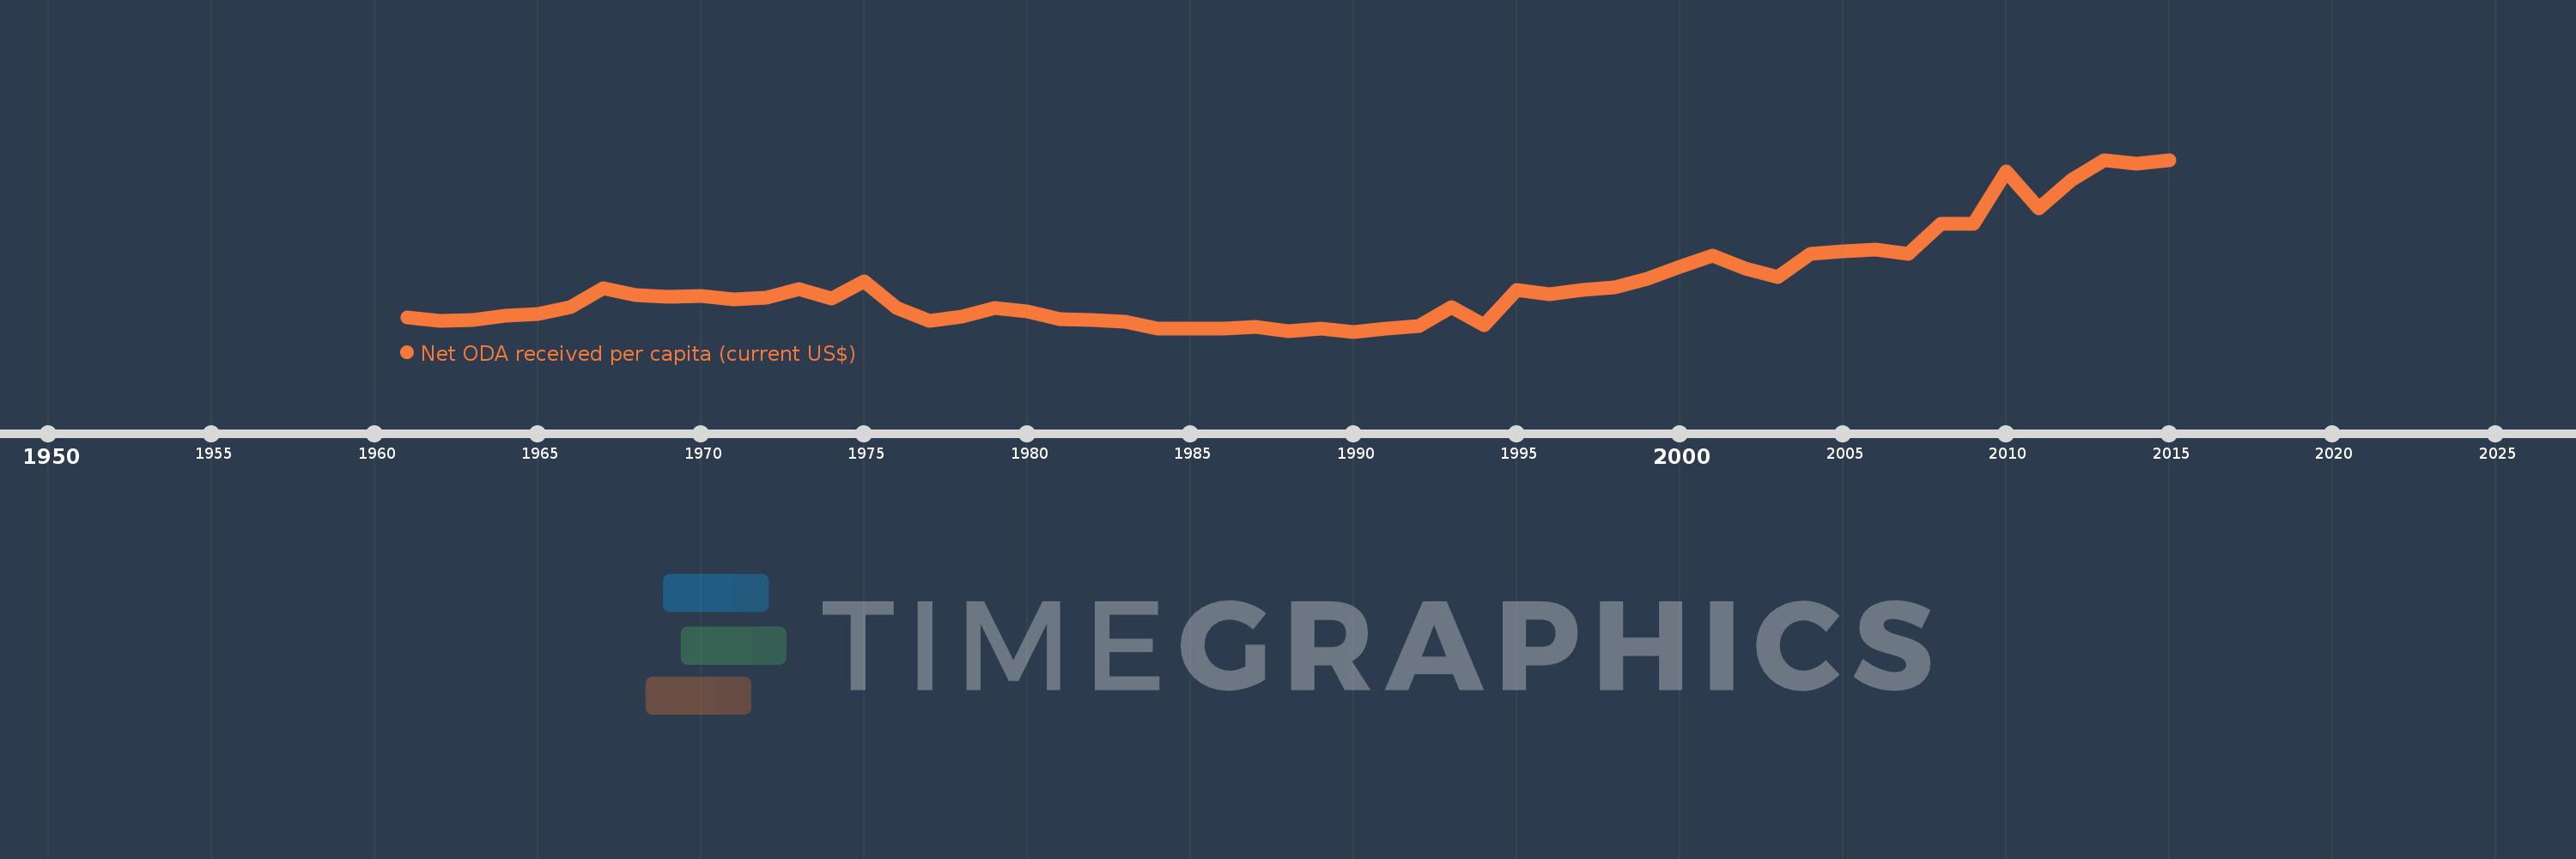
Net ODA received per capita (current US$)
2015,2014,2013,2012,2011,2010,2009,2008,2007,2006,2005,2004,2003,2002,2001,2000,1999,1998,1997,1996,1995,1994,1993,1992,1991,1990,1989,1988,1987,1986,1985,1984,1983,1982,1981,1980,1979,1978,1977,1976,1975,1974,1973,1972,1971,1970,1969,1968,1967,1966,1965,1964,1963,1962,1961
Cette statistique dans les autres pays:
AfghanistanAlbaniaAlgeriaAngolaAntigua and BarbudaArab WorldArgentinaArmeniaArubaAzerbaijanBahamas, TheBahrainBangladeshBarbadosBelarusBelizeBeninBermudaBhutanBoliviaBosnia and HerzegovinaBotswanaBrazilBritish Virgin IslandsBrunei DarussalamBurkina FasoBurundiCabo VerdeCambodiaCameroonCaribbean small statesCayman IslandsCentral African RepublicCentral Europe and the BalticsChadChileChinaColombiaComorosCongo, Dem. Rep.Congo, Rep.Costa RicaCote d'IvoireCroatiaCubaCyprusDjiboutiDominicaDominican RepublicEast Asia & PacificEast Asia & Pacific (excluding high income)East Asia & Pacific (IDA & IBRD countries)EcuadorEgypt, Arab Rep.El SalvadorEquatorial GuineaEritreaEthiopiaEuro areaEurope & Central AsiaEurope & Central Asia (excluding high income)Europe & Central Asia (IDA & IBRD countries)European UnionFijiFragile and conflict affected situationsFrench PolynesiaGabonGambia, TheGeorgiaGhanaGibraltarGrenadaGuatemalaGuineaGuinea-BissauGuyanaHaitiHeavily indebted poor countries (HIPC)High incomeHondurasHong Kong SAR, ChinaIBRD onlyIDA & IBRD totalIDA blendIDA onlyIDA totalIndiaIndonesiaIran, Islamic Rep.IraqIsraelJamaicaJordanKazakhstanKenyaKiribatiKorea, Dem. People’s Rep.Korea, Rep.KosovoKuwaitKyrgyz RepublicLao PDRLatin America & Caribbean Latin America & Caribbean (excluding high income)Latin America & the Caribbean (IDA & IBRD countries)Least developed countries: UN classificationLebanonLesothoLiberiaLibyaLow & middle incomeLow incomeLower middle incomeMacao SAR, ChinaMacedonia, FYRMadagascarMalawiMalaysiaMaldivesMaliMaltaMarshall IslandsMauritaniaMauritiusMexicoMicronesia, Fed. Sts.Middle East & North AfricaMiddle East & North Africa (excluding high income)Middle East & North Africa (IDA & IBRD countries)Middle incomeMoldovaMongoliaMontenegroMoroccoMozambiqueMyanmarNamibiaNauruNepalNew CaledoniaNicaraguaNigerNigeriaNorth AmericaNorthern Mariana IslandsOECD membersOmanOther small statesPacific island small statesPakistanPalauPanamaPapua New GuineaParaguayPeruPhilippinesQatarRwandaSamoaSao Tome and PrincipeSaudi ArabiaSenegalSerbiaSeychellesSierra LeoneSingaporeSloveniaSmall statesSolomon IslandsSomaliaSouth AfricaSouth AsiaSouth Asia (IDA & IBRD)South SudanSri LankaSt. Kitts and NevisSt. LuciaSt. Vincent and the GrenadinesSub-Saharan Africa Sub-Saharan Africa (excluding high income)Sub-Saharan Africa (IDA & IBRD countries)SudanSurinameSwazilandSyrian Arab RepublicTajikistanTanzaniaThailandTimor-LesteTogoTongaTrinidad and TobagoTunisiaTurkeyTurkmenistanTurks and Caicos IslandsTuvaluUgandaUkraineUnited Arab EmiratesUpper middle incomeUruguayUzbekistanVanuatuVenezuela, RBVietnamWest Bank and GazaWorldYemen, Rep.ZambiaZimbabwe La ligne de temps
Cette échelle de temps montre un graphique de 1961 année à 2015 année Vietnam. Les données jusqu'à 1960 année ne sont pas présentés. Quantité d'observations actuelles selon dates: 55.
Source (désignation):
Les indicateurs du développement mondiale
Source (organisation):
Development Assistance Committee of the Organisation for Economic Co-operation and Development, Geographical Distribution of Financial Flows to Developing Countries, Development Co-operation Report, and International Development Statistics database. Data are available online at: www.oecd.org/dac/stats/idsonline. World Bank population estimates are used for the denominator.
Catégories:
Aid Effectiveness, Economy & Growth, External Debt
Dernière mise à jour
23 avr. 2017
Les indicateurs de changement de valeurs selon les années
Minimum:
1.923
1 janv. 1990
Maximum:
46.489
1 janv. 2015
Pour la date d''observation
Valeur
Changement absolu
Le changement par rapport à la valeur précédente
1 janv. 1961
5.522
+5.522
0.0%
1 janv. 1962
4.717
-0.805
-14.58%
1 janv. 1963
4.873
+0.156
3.31%
1 janv. 1964
6.153
+1.28
26.28%
1 janv. 1965
6.52
+0.367
5.96%
1 janv. 1966
8.194
+1.673
25.66%
1 janv. 1967
13.167
+4.973
60.7%
1 janv. 1968
11.491
-1.676
-12.73%
1 janv. 1969
11.005
-0.486
-4.23%
1 janv. 1970
11.116
+0.112
1.02%
1 janv. 1971
10.199
-0.917
-8.25%
1 janv. 1972
10.616
+0.416
4.08%
1 janv. 1973
12.89
+2.275
21.43%
1 janv. 1974
10.42
-2.471
-19.17%
1 janv. 1975
15.046
+4.626
44.4%
1 janv. 1976
8.115
-6.932
-46.07%
1 janv. 1977
4.745
-3.369
-41.52%
1 janv. 1978
5.883
+1.138
23.98%
1 janv. 1979
8.106
+2.223
37.79%
1 janv. 1980
7.264
-0.842
-10.39%
1 janv. 1981
5.157
-2.108
-29.02%
1 janv. 1982
4.99
-0.167
-3.23%
1 janv. 1983
4.451
-0.538
-10.79%
1 janv. 1984
2.643
-1.809
-40.63%
1 janv. 1985
2.641
-0.001
-0.05%
1 janv. 1986
2.596
-0.045
-1.71%
1 janv. 1987
3.177
+0.581
22.37%
1 janv. 1988
2.06
-1.117
-35.16%
1 janv. 1989
2.592
+0.532
25.81%
1 janv. 1990
1.923
-0.669
-25.81%
1 janv. 1991
2.735
+0.812
42.23%
1 janv. 1992
3.38
+0.645
23.6%
1 janv. 1993
8.257
+4.877
144.28%
1 janv. 1994
3.613
-4.645
-56.25%
1 janv. 1995
12.754
+9.141
253.03%
1 janv. 1996
11.595
-1.159
-9.09%
1 janv. 1997
12.794
+1.199
10.34%
1 janv. 1998
13.434
+0.64
5.0%
1 janv. 1999
15.603
+2.169
16.14%
1 janv. 2000
18.651
+3.048
19.53%
1 janv. 2001
21.658
+3.008
16.13%
1 janv. 2002
18.213
-3.445
-15.91%
1 janv. 2003
16.096
-2.118
-11.63%
1 janv. 2004
22.02
+5.924
36.81%
1 janv. 2005
22.672
+0.652
2.96%
1 janv. 2006
23.224
+0.552
2.43%
1 janv. 2007
22.14
-1.083
-4.67%
1 janv. 2008
29.815
+7.674
34.66%
1 janv. 2009
29.981
+0.166
0.56%
1 janv. 2010
43.379
+13.398
44.69%
1 janv. 2011
33.809
-9.57
-22.06%
1 janv. 2012
41.183
+7.374
21.81%
1 janv. 2013
46.323
+5.14
12.48%
1 janv. 2014
45.491
-0.832
-1.8%
1 janv. 2015
46.489
+0.998
2.19%
Classement des pays selon les statistiques actuelles par années


Commentaires: