29
/fr/
fr
AIzaSyAYiBZKx7MnpbEhh9jyipgxe19OcubqV5w
April 1, 2024
54833
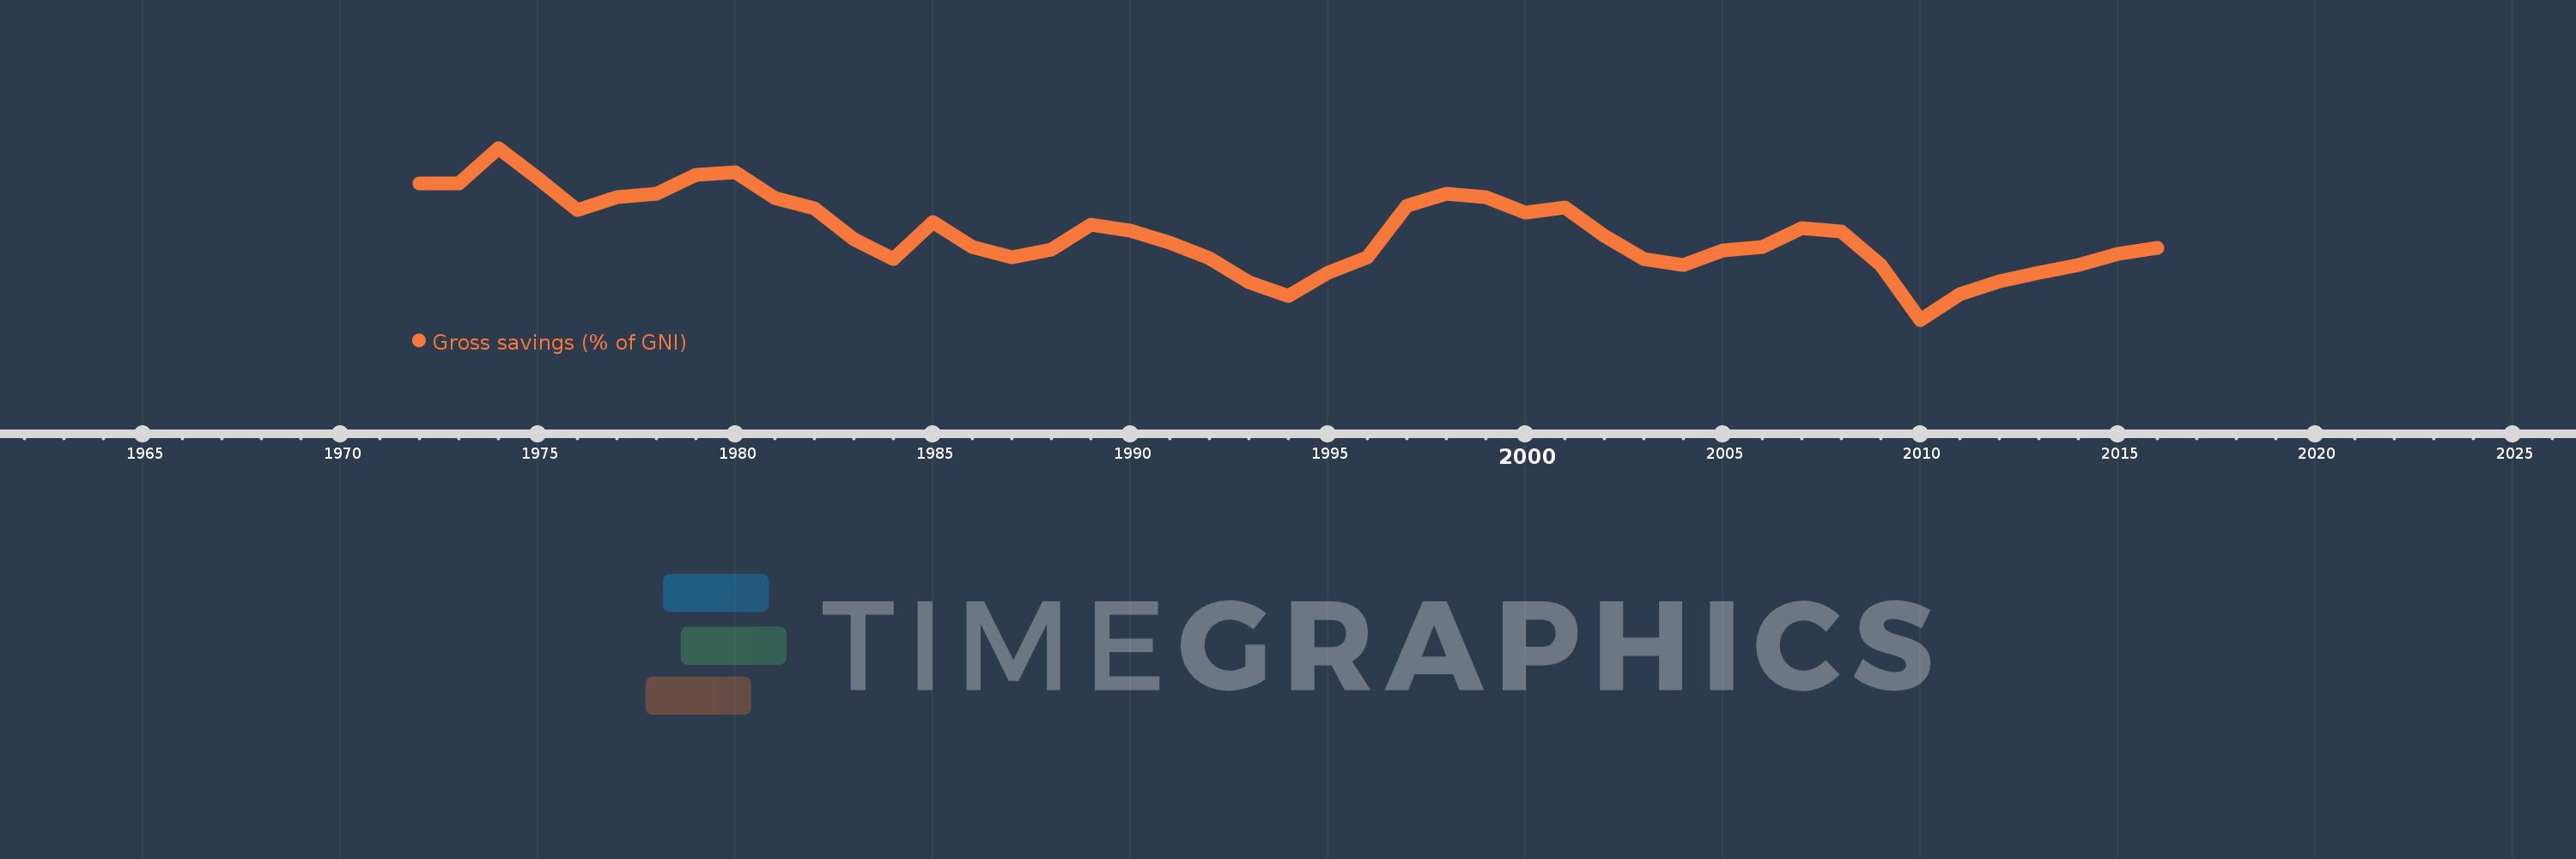
Post-demographic dividend
PST
false
2
1
Gross savings (% of GNI)
2016,2015,2014,2013,2012,2011,2010,2009,2008,2007,2006,2005,2004,2003,2002,2001,2000,1999,1998,1997,1996,1995,1994,1993,1992,1991,1990,1989,1988,1987,1986,1985,1984,1983,1982,1981,1980,1979,1978,1977,1976,1975,1974,1973,1972
Cette statistique dans les autres pays:
AfghanistanAlbaniaAlgeriaAngolaAntigua and BarbudaArab WorldArgentinaArmeniaAustraliaAustriaAzerbaijanBahamas, TheBahrainBangladeshBarbadosBelarusBelgiumBelizeBeninBermudaBhutanBoliviaBosnia and HerzegovinaBotswanaBrazilBrunei DarussalamBulgariaBurkina FasoBurundiCabo VerdeCambodiaCameroonCanadaCaribbean small statesCentral African RepublicCentral Europe and the BalticsChadChileChinaColombiaComorosCongo, Dem. Rep.Congo, Rep.Costa RicaCote d'IvoireCroatiaCyprusCzech RepublicDenmarkDjiboutiDominicaDominican RepublicEarly-demographic dividendEast Asia & PacificEast Asia & Pacific (excluding high income)East Asia & Pacific (IDA & IBRD countries)EcuadorEgypt, Arab Rep.El SalvadorEquatorial GuineaEritreaEstoniaEthiopiaEuro areaEurope & Central AsiaEurope & Central Asia (excluding high income)Europe & Central Asia (IDA & IBRD countries)European UnionFaroe IslandsFijiFinlandFragile and conflict affected situationsFranceGabonGambia, TheGeorgiaGermanyGhanaGreeceGrenadaGuatemalaGuineaGuinea-BissauGuyanaHaitiHeavily indebted poor countries (HIPC)High incomeHondurasHong Kong SAR, ChinaHungaryIBRD onlyIcelandIDA & IBRD totalIDA blendIDA onlyIDA totalIndiaIndonesiaIran, Islamic Rep.IraqIrelandIsraelItalyJamaicaJapanJordanKazakhstanKenyaKiribatiKorea, Rep.KosovoKuwaitKyrgyz RepublicLao PDRLate-demographic dividendLatin America & Caribbean Latin America & Caribbean (excluding high income)Latin America & the Caribbean (IDA & IBRD countries)LatviaLeast developed countries: UN classificationLebanonLesothoLiberiaLibyaLithuaniaLow & middle incomeLow incomeLower middle incomeLuxembourgMacao SAR, ChinaMacedonia, FYRMadagascarMalawiMalaysiaMaldivesMaliMaltaMauritaniaMauritiusMexicoMiddle East & North AfricaMiddle East & North Africa (excluding high income)Middle East & North Africa (IDA & IBRD countries)Middle incomeMoldovaMongoliaMontenegroMoroccoMozambiqueNamibiaNepalNetherlandsNew ZealandNicaraguaNigerNigeriaNorth AmericaNorwayOECD membersOmanOther small statesPacific island small statesPakistanPanamaPapua New GuineaParaguayPeruPhilippinesPolandPortugalPost-demographic dividendPre-demographic dividendQatarRomaniaRussian FederationRwandaSaudi ArabiaSenegalSerbiaSeychellesSierra LeoneSingaporeSlovak RepublicSloveniaSmall statesSolomon IslandsSouth AfricaSouth AsiaSouth Asia (IDA & IBRD)South SudanSpainSri LankaSt. Kitts and NevisSt. LuciaSt. Vincent and the GrenadinesSub-Saharan Africa Sub-Saharan Africa (excluding high income)Sub-Saharan Africa (IDA & IBRD countries)SudanSurinameSwazilandSwedenSwitzerlandSyrian Arab RepublicTajikistanTanzaniaThailandTimor-LesteTogoTongaTrinidad and TobagoTunisiaTurkeyUgandaUkraineUnited KingdomUnited StatesUpper middle incomeUruguayVanuatuVenezuela, RBVietnamWest Bank and GazaWorldYemen, Rep.ZambiaZimbabwe La ligne de temps
Cette échelle de temps montre un graphique de 1972 année à 2016 année Post-demographic dividend. Les données jusqu'à 1971 année ne sont pas présentés. Quantité d'observations actuelles selon dates: 45.
Source (désignation):
Les indicateurs du développement mondiale
Source (organisation):
World Bank national accounts data, and OECD National Accounts data files.
Catégories:
Economy & Growth
Dernière mise à jour
23 avr. 2017
Les indicateurs de changement de valeurs selon les années
Minimum:
18.959
1 janv. 2010
Maximum:
25.118
1 janv. 1974
Pour la date d''observation
Valeur
Changement absolu
Le changement par rapport à la valeur précédente
1 janv. 1972
23.841
+23.841
0.0%
1 janv. 1973
23.854
+0.013
0.05%
1 janv. 1974
25.118
+1.264
5.3%
1 janv. 1975
24.043
-1.075
-4.28%
1 janv. 1976
22.906
-1.137
-4.73%
1 janv. 1977
23.353
+0.448
1.95%
1 janv. 1978
23.485
+0.131
0.56%
1 janv. 1979
24.168
+0.683
2.91%
1 janv. 1980
24.235
+0.068
0.28%
1 janv. 1981
23.337
-0.898
-3.71%
1 janv. 1982
22.962
-0.375
-1.61%
1 janv. 1983
21.853
-1.109
-4.83%
1 janv. 1984
21.149
-0.705
-3.22%
1 janv. 1985
22.447
+1.298
6.14%
1 janv. 1986
21.56
-0.886
-3.95%
1 janv. 1987
21.204
-0.357
-1.65%
1 janv. 1988
21.465
+0.261
1.23%
1 janv. 1989
22.366
+0.901
4.2%
1 janv. 1990
22.15
-0.216
-0.97%
1 janv. 1991
21.723
-0.427
-1.93%
1 janv. 1992
21.18
-0.544
-2.5%
1 janv. 1993
20.308
-0.871
-4.11%
1 janv. 1994
19.823
-0.486
-2.39%
1 janv. 1995
20.639
+0.816
4.11%
1 janv. 1996
21.208
+0.569
2.76%
1 janv. 1997
23.053
+1.846
8.7%
1 janv. 1998
23.479
+0.426
1.85%
1 janv. 1999
23.365
-0.114
-0.49%
1 janv. 2000
22.799
-0.567
-2.42%
1 janv. 2001
22.99
+0.191
0.84%
1 janv. 2002
21.97
-1.019
-4.43%
1 janv. 2003
21.122
-0.848
-3.86%
1 janv. 2004
20.907
-0.216
-1.02%
1 janv. 2005
21.45
+0.544
2.6%
1 janv. 2006
21.557
+0.106
0.5%
1 janv. 2007
22.254
+0.698
3.24%
1 janv. 2008
22.132
-0.122
-0.55%
1 janv. 2009
20.933
-1.198
-5.41%
1 janv. 2010
18.959
-1.975
-9.43%
1 janv. 2011
19.88
+0.922
4.86%
1 janv. 2012
20.344
+0.464
2.33%
1 janv. 2013
20.658
+0.314
1.55%
1 janv. 2014
20.913
+0.254
1.23%
1 janv. 2015
21.313
+0.4
1.91%
1 janv. 2016
21.522
+0.209
0.98%
Classement des pays selon les statistiques actuelles par années


Commentaires: