29
/fr/
fr
AIzaSyAYiBZKx7MnpbEhh9jyipgxe19OcubqV5w
April 1, 2024
222261
Peru
PER
true
2
1
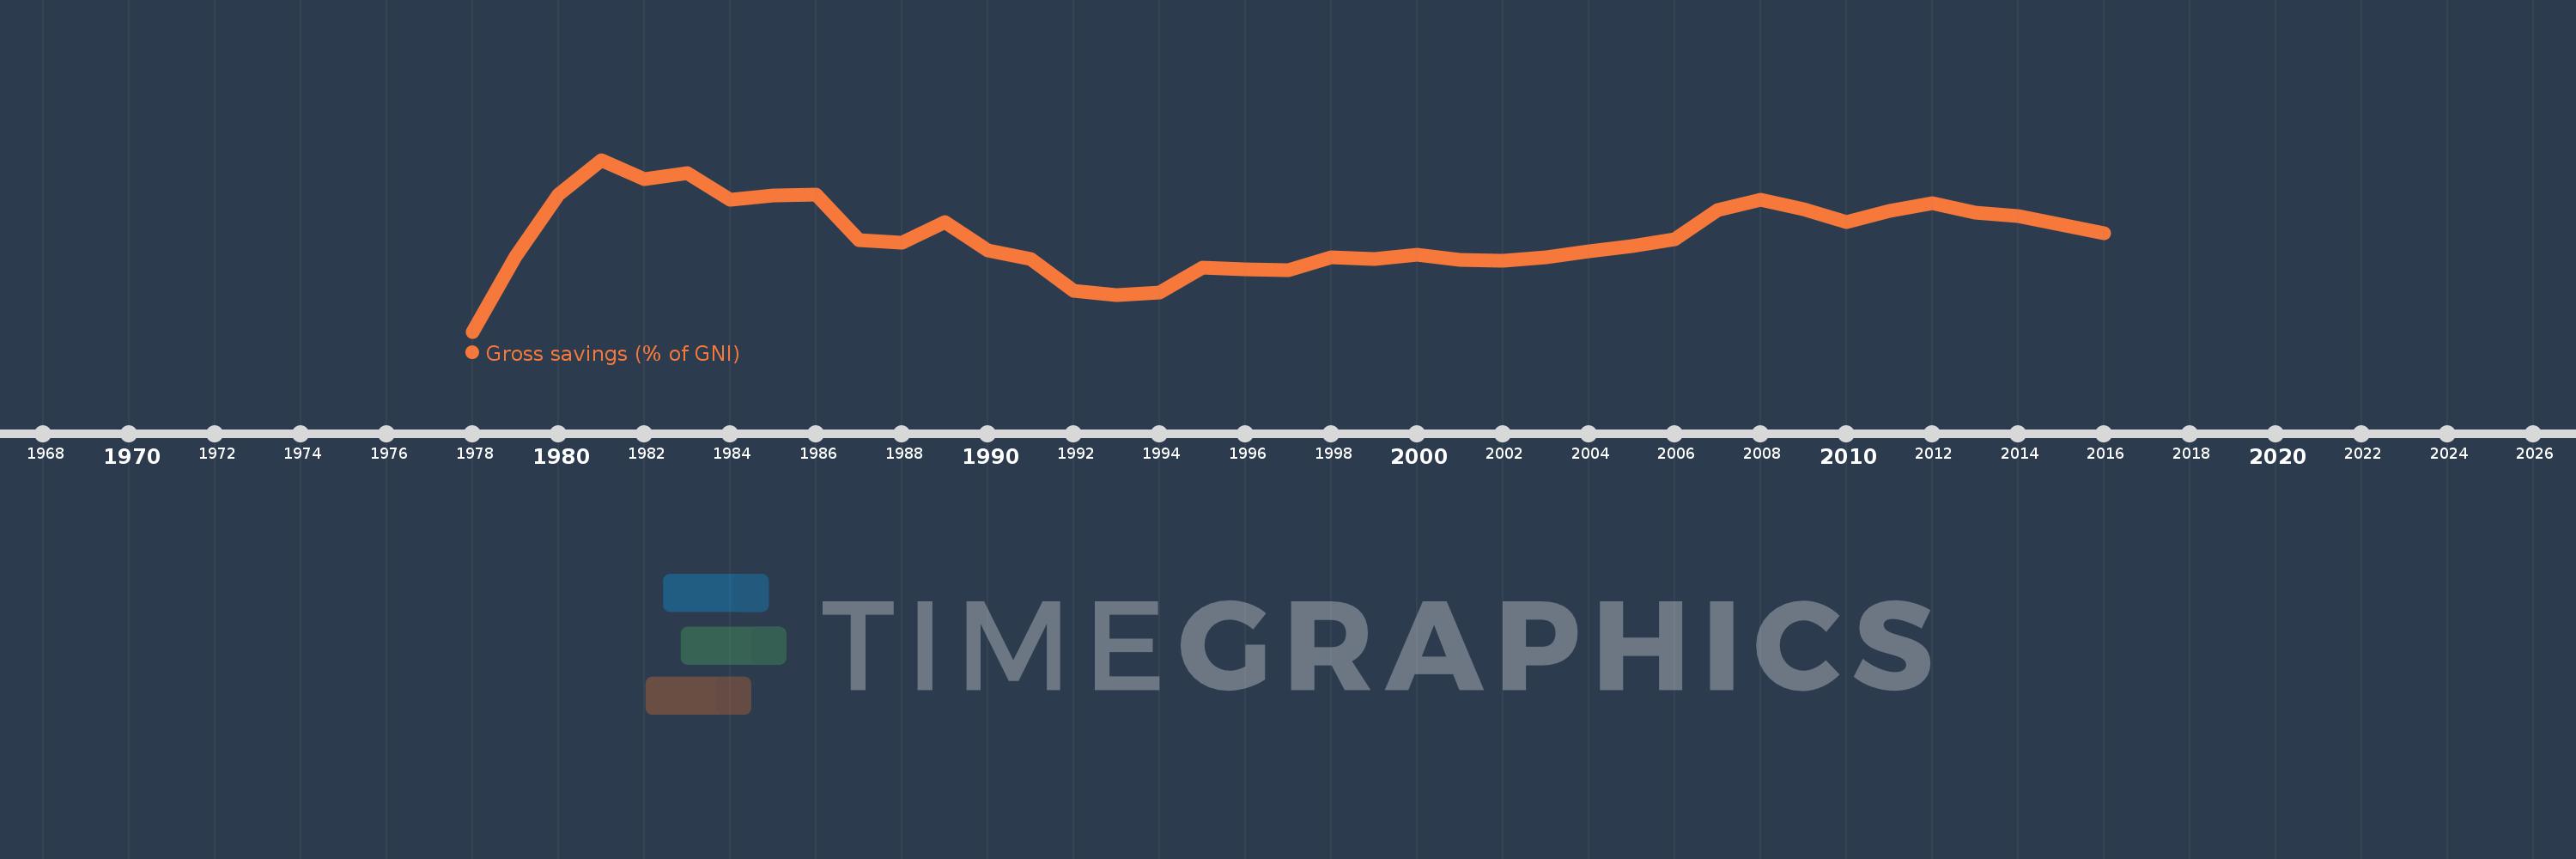
Gross savings (% of GNI)
2016,2015,2014,2013,2012,2011,2010,2009,2008,2007,2006,2005,2004,2003,2002,2001,2000,1999,1998,1997,1996,1995,1994,1993,1992,1991,1990,1989,1988,1987,1986,1985,1984,1983,1982,1981,1980,1979,1978
Cette statistique dans les autres pays:
AfghanistanAlbaniaAlgeriaAngolaAntigua and BarbudaArab WorldArgentinaArmeniaAustraliaAustriaAzerbaijanBahamas, TheBahrainBangladeshBarbadosBelarusBelgiumBelizeBeninBermudaBhutanBoliviaBosnia and HerzegovinaBotswanaBrazilBrunei DarussalamBulgariaBurkina FasoBurundiCabo VerdeCambodiaCameroonCanadaCaribbean small statesCentral African RepublicCentral Europe and the BalticsChadChileChinaColombiaComorosCongo, Dem. Rep.Congo, Rep.Costa RicaCote d'IvoireCroatiaCyprusCzech RepublicDenmarkDjiboutiDominicaDominican RepublicEarly-demographic dividendEast Asia & PacificEast Asia & Pacific (excluding high income)East Asia & Pacific (IDA & IBRD countries)EcuadorEgypt, Arab Rep.El SalvadorEquatorial GuineaEritreaEstoniaEthiopiaEuro areaEurope & Central AsiaEurope & Central Asia (excluding high income)Europe & Central Asia (IDA & IBRD countries)European UnionFaroe IslandsFijiFinlandFragile and conflict affected situationsFranceGabonGambia, TheGeorgiaGermanyGhanaGreeceGrenadaGuatemalaGuineaGuinea-BissauGuyanaHaitiHeavily indebted poor countries (HIPC)High incomeHondurasHong Kong SAR, ChinaHungaryIBRD onlyIcelandIDA & IBRD totalIDA blendIDA onlyIDA totalIndiaIndonesiaIran, Islamic Rep.IraqIrelandIsraelItalyJamaicaJapanJordanKazakhstanKenyaKiribatiKorea, Rep.KosovoKuwaitKyrgyz RepublicLao PDRLate-demographic dividendLatin America & Caribbean Latin America & Caribbean (excluding high income)Latin America & the Caribbean (IDA & IBRD countries)LatviaLeast developed countries: UN classificationLebanonLesothoLiberiaLibyaLithuaniaLow & middle incomeLow incomeLower middle incomeLuxembourgMacao SAR, ChinaMacedonia, FYRMadagascarMalawiMalaysiaMaldivesMaliMaltaMauritaniaMauritiusMexicoMiddle East & North AfricaMiddle East & North Africa (excluding high income)Middle East & North Africa (IDA & IBRD countries)Middle incomeMoldovaMongoliaMontenegroMoroccoMozambiqueNamibiaNepalNetherlandsNew ZealandNicaraguaNigerNigeriaNorth AmericaNorwayOECD membersOmanOther small statesPacific island small statesPakistanPanamaPapua New GuineaParaguayPeruPhilippinesPolandPortugalPost-demographic dividendPre-demographic dividendQatarRomaniaRussian FederationRwandaSaudi ArabiaSenegalSerbiaSeychellesSierra LeoneSingaporeSlovak RepublicSloveniaSmall statesSolomon IslandsSouth AfricaSouth AsiaSouth Asia (IDA & IBRD)South SudanSpainSri LankaSt. Kitts and NevisSt. LuciaSt. Vincent and the GrenadinesSub-Saharan Africa Sub-Saharan Africa (excluding high income)Sub-Saharan Africa (IDA & IBRD countries)SudanSurinameSwazilandSwedenSwitzerlandSyrian Arab RepublicTajikistanTanzaniaThailandTimor-LesteTogoTongaTrinidad and TobagoTunisiaTurkeyUgandaUkraineUnited KingdomUnited StatesUpper middle incomeUruguayVanuatuVenezuela, RBVietnamWest Bank and GazaWorldYemen, Rep.ZambiaZimbabwe La ligne de temps
Cette échelle de temps montre un graphique de 1978 année à 2016 année Peru. Les données jusqu'à 1977 année ne sont pas présentés. Quantité d'observations actuelles selon dates: 39.
Source (désignation):
Les indicateurs du développement mondiale
Source (organisation):
World Bank national accounts data, and OECD National Accounts data files.
Catégories:
Economy & Growth
Dernière mise à jour
23 avr. 2017
Les indicateurs de changement de valeurs selon les années
Minimum:
4.014
1 janv. 1978
Maximum:
32.766
1 janv. 1981
Pour la date d''observation
Valeur
Changement absolu
Le changement par rapport à la valeur précédente
1 janv. 1978
4.014
+4.014
0.0%
1 janv. 1979
16.552
+12.538
312.32%
1 janv. 1980
26.913
+10.361
62.6%
1 janv. 1981
32.766
+5.852
21.75%
1 janv. 1982
29.49
-3.275
-10.0%
1 janv. 1983
30.592
+1.102
3.74%
1 janv. 1984
26.061
-4.531
-14.81%
1 janv. 1985
26.848
+0.786
3.02%
1 janv. 1986
26.98
+0.132
0.49%
1 janv. 1987
19.384
-7.596
-28.16%
1 janv. 1988
18.903
-0.48
-2.48%
1 janv. 1989
22.404
+3.501
18.52%
1 janv. 1990
17.616
-4.788
-21.37%
1 janv. 1991
16.105
-1.511
-8.58%
1 janv. 1992
10.86
-5.245
-32.57%
1 janv. 1993
10.066
-0.794
-7.31%
1 janv. 1994
10.555
+0.49
4.86%
1 janv. 1995
14.664
+4.108
38.92%
1 janv. 1996
14.468
-0.196
-1.33%
1 janv. 1997
14.291
-0.178
-1.23%
1 janv. 1998
16.403
+2.112
14.78%
1 janv. 1999
16.157
-0.246
-1.5%
1 janv. 2000
16.87
+0.714
4.42%
1 janv. 2001
16.035
-0.836
-4.95%
1 janv. 2002
15.806
-0.229
-1.43%
1 janv. 2003
16.411
+0.605
3.83%
1 janv. 2004
17.407
+0.995
6.07%
1 janv. 2005
18.341
+0.935
5.37%
1 janv. 2006
19.408
+1.067
5.82%
1 janv. 2007
24.315
+4.907
25.28%
1 janv. 2008
26.136
+1.821
7.49%
1 janv. 2009
24.435
-1.701
-6.51%
1 janv. 2010
22.308
-2.127
-8.7%
1 janv. 2011
24.226
+1.918
8.6%
1 janv. 2012
25.501
+1.275
5.26%
1 janv. 2013
23.885
-1.617
-6.34%
1 janv. 2014
23.338
-0.547
-2.29%
1 janv. 2015
21.877
-1.461
-6.26%
1 janv. 2016
20.417
-1.459
-6.67%
Classement des pays selon les statistiques actuelles par années


Commentaires: