29
/fr/
fr
AIzaSyAYiBZKx7MnpbEhh9jyipgxe19OcubqV5w
April 1, 2024
213032
Nigeria
NGA
true
2
1
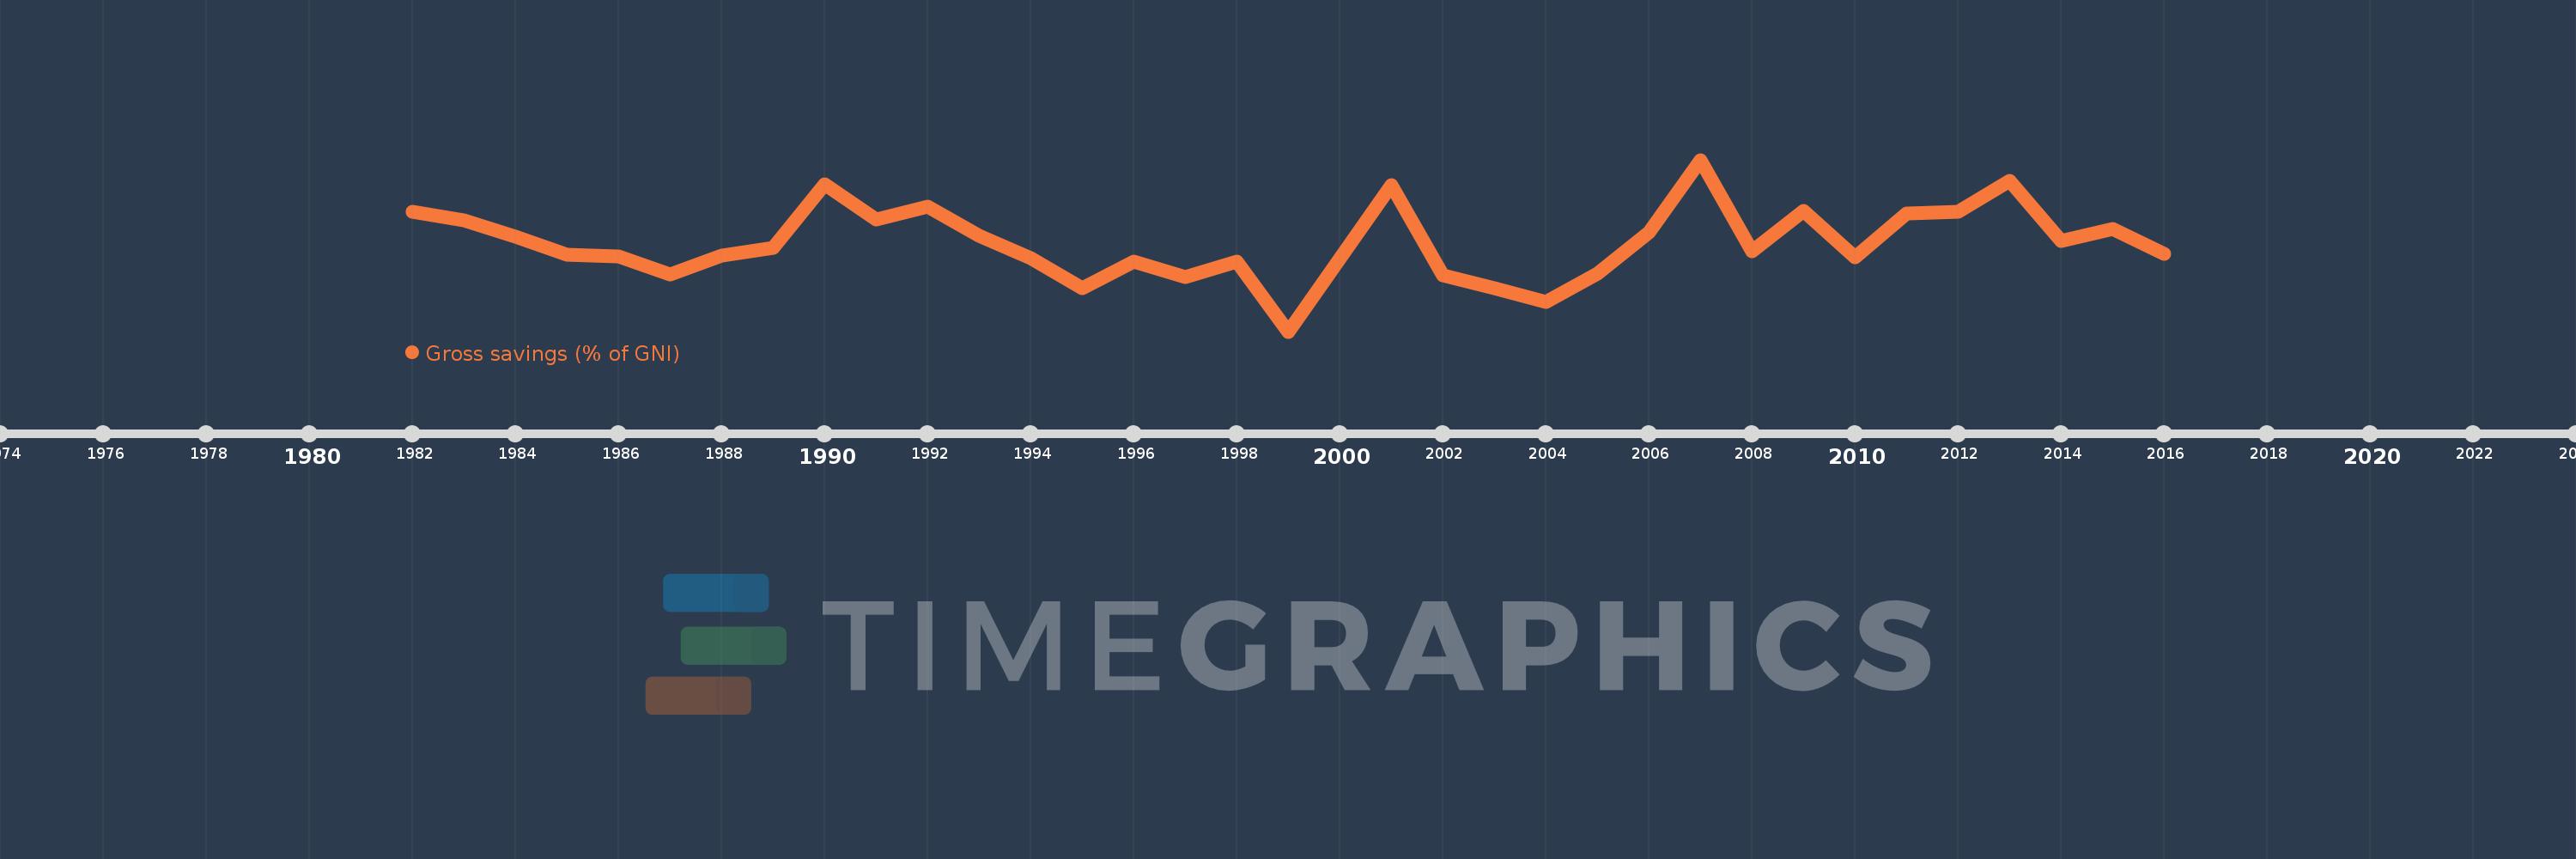
Gross savings (% of GNI)
2016,2015,2014,2013,2012,2011,2010,2009,2008,2007,2006,2005,2004,2003,2002,2001,1999,1998,1997,1996,1995,1994,1993,1992,1991,1990,1989,1988,1987,1986,1985,1984,1983,1982
Cette statistique dans les autres pays:
AfghanistanAlbaniaAlgeriaAngolaAntigua and BarbudaArab WorldArgentinaArmeniaAustraliaAustriaAzerbaijanBahamas, TheBahrainBangladeshBarbadosBelarusBelgiumBelizeBeninBermudaBhutanBoliviaBosnia and HerzegovinaBotswanaBrazilBrunei DarussalamBulgariaBurkina FasoBurundiCabo VerdeCambodiaCameroonCanadaCaribbean small statesCentral African RepublicCentral Europe and the BalticsChadChileChinaColombiaComorosCongo, Dem. Rep.Congo, Rep.Costa RicaCote d'IvoireCroatiaCyprusCzech RepublicDenmarkDjiboutiDominicaDominican RepublicEarly-demographic dividendEast Asia & PacificEast Asia & Pacific (excluding high income)East Asia & Pacific (IDA & IBRD countries)EcuadorEgypt, Arab Rep.El SalvadorEquatorial GuineaEritreaEstoniaEthiopiaEuro areaEurope & Central AsiaEurope & Central Asia (excluding high income)Europe & Central Asia (IDA & IBRD countries)European UnionFaroe IslandsFijiFinlandFragile and conflict affected situationsFranceGabonGambia, TheGeorgiaGermanyGhanaGreeceGrenadaGuatemalaGuineaGuinea-BissauGuyanaHaitiHeavily indebted poor countries (HIPC)High incomeHondurasHong Kong SAR, ChinaHungaryIBRD onlyIcelandIDA & IBRD totalIDA blendIDA onlyIDA totalIndiaIndonesiaIran, Islamic Rep.IraqIrelandIsraelItalyJamaicaJapanJordanKazakhstanKenyaKiribatiKorea, Rep.KosovoKuwaitKyrgyz RepublicLao PDRLate-demographic dividendLatin America & Caribbean Latin America & Caribbean (excluding high income)Latin America & the Caribbean (IDA & IBRD countries)LatviaLeast developed countries: UN classificationLebanonLesothoLiberiaLibyaLithuaniaLow & middle incomeLow incomeLower middle incomeLuxembourgMacao SAR, ChinaMacedonia, FYRMadagascarMalawiMalaysiaMaldivesMaliMaltaMauritaniaMauritiusMexicoMiddle East & North AfricaMiddle East & North Africa (excluding high income)Middle East & North Africa (IDA & IBRD countries)Middle incomeMoldovaMongoliaMontenegroMoroccoMozambiqueNamibiaNepalNetherlandsNew ZealandNicaraguaNigerNigeriaNorth AmericaNorwayOECD membersOmanOther small statesPacific island small statesPakistanPanamaPapua New GuineaParaguayPeruPhilippinesPolandPortugalPost-demographic dividendPre-demographic dividendQatarRomaniaRussian FederationRwandaSaudi ArabiaSenegalSerbiaSeychellesSierra LeoneSingaporeSlovak RepublicSloveniaSmall statesSolomon IslandsSouth AfricaSouth AsiaSouth Asia (IDA & IBRD)South SudanSpainSri LankaSt. Kitts and NevisSt. LuciaSt. Vincent and the GrenadinesSub-Saharan Africa Sub-Saharan Africa (excluding high income)Sub-Saharan Africa (IDA & IBRD countries)SudanSurinameSwazilandSwedenSwitzerlandSyrian Arab RepublicTajikistanTanzaniaThailandTimor-LesteTogoTongaTrinidad and TobagoTunisiaTurkeyUgandaUkraineUnited KingdomUnited StatesUpper middle incomeUruguayVanuatuVenezuela, RBVietnamWest Bank and GazaWorldYemen, Rep.ZambiaZimbabwe La ligne de temps
Cette échelle de temps montre un graphique de 1982 année à 2016 année Nigeria. Les données jusqu'à 1981 année ne sont pas présentés. Quantité d'observations actuelles selon dates: 34.
Source (désignation):
Les indicateurs du développement mondiale
Source (organisation):
World Bank national accounts data, and OECD National Accounts data files.
Catégories:
Economy & Growth
Dernière mise à jour
23 avr. 2017
Les indicateurs de changement de valeurs selon les années
Minimum:
-2.301
1 janv. 1999
Maximum:
40.217
1 janv. 2007
Pour la date d''observation
Valeur
Changement absolu
Le changement par rapport à la valeur précédente
1 janv. 1982
27.32
+27.32
0.0%
1 janv. 1983
25.266
-2.054
-7.52%
1 janv. 1984
21.294
-3.971
-15.72%
1 janv. 1985
16.77
-4.524
-21.25%
1 janv. 1986
16.365
-0.405
-2.41%
1 janv. 1987
11.9
-4.465
-27.28%
1 janv. 1988
16.502
+4.602
38.67%
1 janv. 1989
18.405
+1.903
11.53%
1 janv. 1990
34.173
+15.768
85.67%
1 janv. 1991
25.354
-8.819
-25.81%
1 janv. 1992
28.637
+3.283
12.95%
1 janv. 1993
21.452
-7.185
-25.09%
1 janv. 1994
15.794
-5.658
-26.38%
1 janv. 1995
8.334
-7.46
-47.23%
1 janv. 1996
15.027
+6.693
80.3%
1 janv. 1997
11.123
-3.903
-25.98%
1 janv. 1998
15.112
+3.989
35.86%
1 janv. 1999
-2.301
-17.413
-115.23%
1 janv. 2001
33.851
+36.152
-1.57 milles%
1 janv. 2002
11.568
-22.283
-65.83%
1 janv. 2003
8.524
-3.045
-26.32%
1 janv. 2004
5.078
-3.446
-40.43%
1 janv. 2005
11.958
+6.881
135.51%
1 janv. 2006
22.276
+10.318
86.28%
1 janv. 2007
40.217
+17.941
80.54%
1 janv. 2008
17.521
-22.696
-56.43%
1 janv. 2009
27.658
+10.137
57.86%
1 janv. 2010
16.039
-11.619
-42.01%
1 janv. 2011
26.895
+10.856
67.69%
1 janv. 2012
27.343
+0.448
1.67%
1 janv. 2013
34.997
+7.653
27.99%
1 janv. 2014
20.202
-14.795
-42.27%
1 janv. 2015
23.019
+2.817
13.94%
1 janv. 2016
16.946
-6.072
-26.38%
Classement des pays selon les statistiques actuelles par années


Commentaires: