29
/fr/
fr
AIzaSyAYiBZKx7MnpbEhh9jyipgxe19OcubqV5w
April 1, 2024
251953
St. Vincent and the Grenadines
VCT
true
2
1
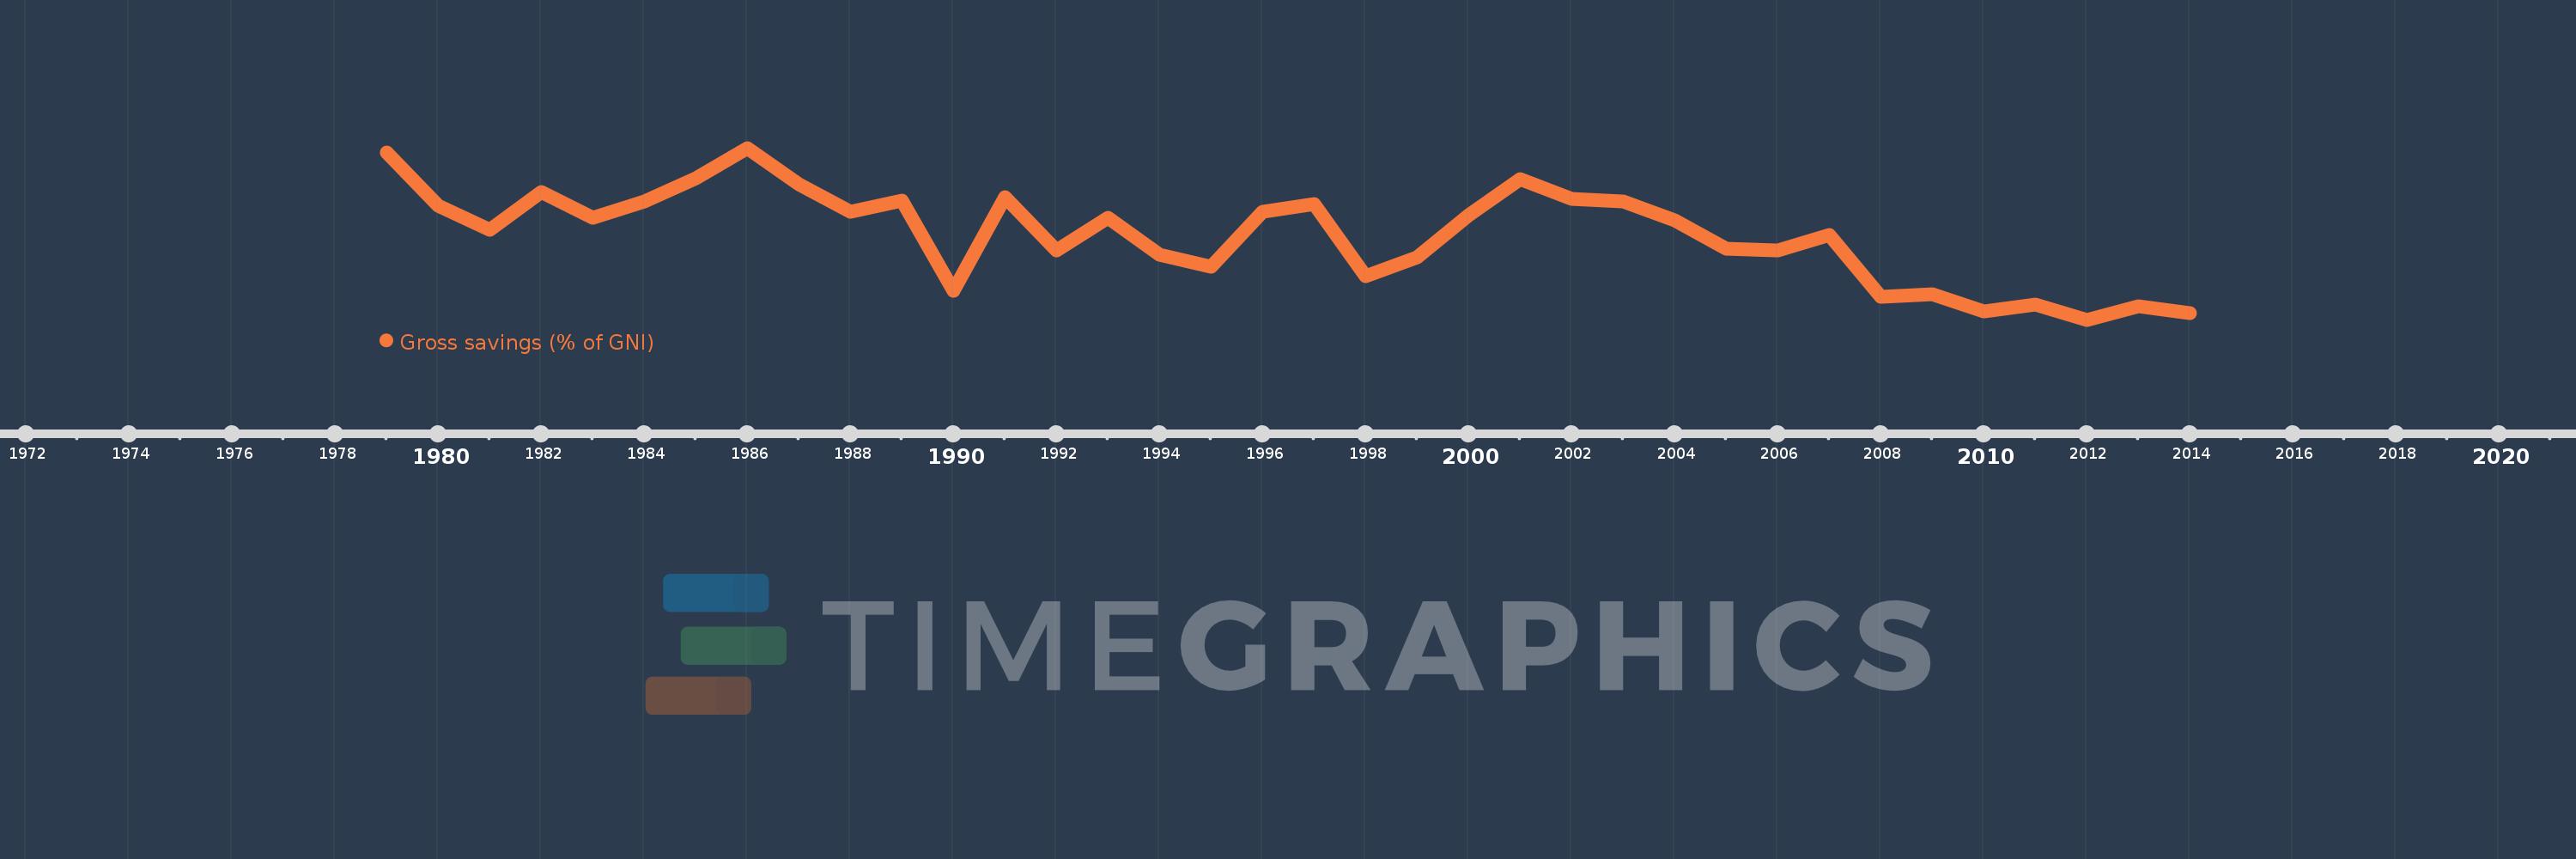
Gross savings (% of GNI)
2014,2013,2012,2011,2010,2009,2008,2007,2006,2005,2004,2003,2002,2001,2000,1999,1998,1997,1996,1995,1994,1993,1992,1991,1990,1989,1988,1987,1986,1985,1984,1983,1982,1981,1980,1979
Cette statistique dans les autres pays:
AfghanistanAlbaniaAlgeriaAngolaAntigua and BarbudaArab WorldArgentinaArmeniaAustraliaAustriaAzerbaijanBahamas, TheBahrainBangladeshBarbadosBelarusBelgiumBelizeBeninBermudaBhutanBoliviaBosnia and HerzegovinaBotswanaBrazilBrunei DarussalamBulgariaBurkina FasoBurundiCabo VerdeCambodiaCameroonCanadaCaribbean small statesCentral African RepublicCentral Europe and the BalticsChadChileChinaColombiaComorosCongo, Dem. Rep.Congo, Rep.Costa RicaCote d'IvoireCroatiaCyprusCzech RepublicDenmarkDjiboutiDominicaDominican RepublicEarly-demographic dividendEast Asia & PacificEast Asia & Pacific (excluding high income)East Asia & Pacific (IDA & IBRD countries)EcuadorEgypt, Arab Rep.El SalvadorEquatorial GuineaEritreaEstoniaEthiopiaEuro areaEurope & Central AsiaEurope & Central Asia (excluding high income)Europe & Central Asia (IDA & IBRD countries)European UnionFaroe IslandsFijiFinlandFragile and conflict affected situationsFranceGabonGambia, TheGeorgiaGermanyGhanaGreeceGrenadaGuatemalaGuineaGuinea-BissauGuyanaHaitiHeavily indebted poor countries (HIPC)High incomeHondurasHong Kong SAR, ChinaHungaryIBRD onlyIcelandIDA & IBRD totalIDA blendIDA onlyIDA totalIndiaIndonesiaIran, Islamic Rep.IraqIrelandIsraelItalyJamaicaJapanJordanKazakhstanKenyaKiribatiKorea, Rep.KosovoKuwaitKyrgyz RepublicLao PDRLate-demographic dividendLatin America & Caribbean Latin America & Caribbean (excluding high income)Latin America & the Caribbean (IDA & IBRD countries)LatviaLeast developed countries: UN classificationLebanonLesothoLiberiaLibyaLithuaniaLow & middle incomeLow incomeLower middle incomeLuxembourgMacao SAR, ChinaMacedonia, FYRMadagascarMalawiMalaysiaMaldivesMaliMaltaMauritaniaMauritiusMexicoMiddle East & North AfricaMiddle East & North Africa (excluding high income)Middle East & North Africa (IDA & IBRD countries)Middle incomeMoldovaMongoliaMontenegroMoroccoMozambiqueNamibiaNepalNetherlandsNew ZealandNicaraguaNigerNigeriaNorth AmericaNorwayOECD membersOmanOther small statesPacific island small statesPakistanPanamaPapua New GuineaParaguayPeruPhilippinesPolandPortugalPost-demographic dividendPre-demographic dividendQatarRomaniaRussian FederationRwandaSaudi ArabiaSenegalSerbiaSeychellesSierra LeoneSingaporeSlovak RepublicSloveniaSmall statesSolomon IslandsSouth AfricaSouth AsiaSouth Asia (IDA & IBRD)South SudanSpainSri LankaSt. Kitts and NevisSt. LuciaSt. Vincent and the GrenadinesSub-Saharan Africa Sub-Saharan Africa (excluding high income)Sub-Saharan Africa (IDA & IBRD countries)SudanSurinameSwazilandSwedenSwitzerlandSyrian Arab RepublicTajikistanTanzaniaThailandTimor-LesteTogoTongaTrinidad and TobagoTunisiaTurkeyUgandaUkraineUnited KingdomUnited StatesUpper middle incomeUruguayVanuatuVenezuela, RBVietnamWest Bank and GazaWorldYemen, Rep.ZambiaZimbabwe La ligne de temps
Cette échelle de temps montre un graphique de 1979 année à 2014 année St. Vincent and the Grenadines. Les données jusqu'à 1978 année ne sont pas présentés. Quantité d'observations actuelles selon dates: 36.
Source (désignation):
Les indicateurs du développement mondiale
Source (organisation):
World Bank national accounts data, and OECD National Accounts data files.
Catégories:
Economy & Growth
Dernière mise à jour
23 avr. 2017
Les indicateurs de changement de valeurs selon les années
Minimum:
-4.058
1 janv. 2012
Maximum:
23.145
1 janv. 1986
Pour la date d''observation
Valeur
Changement absolu
Le changement par rapport à la valeur précédente
1 janv. 1979
22.419
+22.419
0.0%
1 janv. 1980
13.964
-8.454
-37.71%
1 janv. 1981
10.201
-3.764
-26.95%
1 janv. 1982
16.135
+5.934
58.17%
1 janv. 1983
12.059
-4.076
-25.26%
1 janv. 1984
14.617
+2.558
21.21%
1 janv. 1985
18.4
+3.783
25.88%
1 janv. 1986
23.145
+4.745
25.79%
1 janv. 1987
17.344
-5.801
-25.06%
1 janv. 1988
13.049
-4.296
-24.77%
1 janv. 1989
14.795
+1.746
13.38%
1 janv. 1990
0.572
-14.223
-96.13%
1 janv. 1991
15.419
+14.847
2.6 milles%
1 janv. 1992
6.931
-8.488
-55.05%
1 janv. 1993
12.02
+5.089
73.43%
1 janv. 1994
6.24
-5.78
-48.09%
1 janv. 1995
4.355
-1.885
-30.2%
1 janv. 1996
12.999
+8.644
198.5%
1 janv. 1997
14.224
+1.224
9.42%
1 janv. 1998
2.901
-11.323
-79.6%
1 janv. 1999
5.868
+2.967
102.27%
1 janv. 2000
12.492
+6.624
112.89%
1 janv. 2001
18.258
+5.766
46.16%
1 janv. 2002
15.038
-3.221
-17.64%
1 janv. 2003
14.72
-0.317
-2.11%
1 janv. 2004
11.682
-3.038
-20.64%
1 janv. 2005
7.227
-4.455
-38.14%
1 janv. 2006
6.888
-0.339
-4.69%
1 janv. 2007
9.319
+2.431
35.29%
1 janv. 2008
-0.44
-9.759
-104.72%
1 janv. 2009
0.028
+0.469
-106.47%
1 janv. 2010
-2.79
-2.818
-9.9 milles%
1 janv. 2011
-1.62
+1.169
-41.91%
1 janv. 2012
-4.058
-2.437
150.41%
1 janv. 2013
-1.972
+2.086
-51.41%
1 janv. 2014
-3.058
-1.086
55.07%
Classement des pays selon les statistiques actuelles par années


Commentaires: