29
/fr/
fr
AIzaSyAYiBZKx7MnpbEhh9jyipgxe19OcubqV5w
April 1, 2024
218415
Panama
PAN
true
2
1
Gross savings (% of GNI)
2015,2014,2013,2012,2011,2010,2009,2008,2007,2006,2005,2004,2003,2002,2001,2000,1999,1998,1997,1996,1995,1994,1993,1992,1991,1990,1989,1988,1987,1986,1985,1984,1983,1982,1981,1980,1979,1978
Cette statistique dans les autres pays:
AfghanistanAlbaniaAlgeriaAngolaAntigua and BarbudaArab WorldArgentinaArmeniaAustraliaAustriaAzerbaijanBahamas, TheBahrainBangladeshBarbadosBelarusBelgiumBelizeBeninBermudaBhutanBoliviaBosnia and HerzegovinaBotswanaBrazilBrunei DarussalamBulgariaBurkina FasoBurundiCabo VerdeCambodiaCameroonCanadaCaribbean small statesCentral African RepublicCentral Europe and the BalticsChadChileChinaColombiaComorosCongo, Dem. Rep.Congo, Rep.Costa RicaCote d'IvoireCroatiaCyprusCzech RepublicDenmarkDjiboutiDominicaDominican RepublicEarly-demographic dividendEast Asia & PacificEast Asia & Pacific (excluding high income)East Asia & Pacific (IDA & IBRD countries)EcuadorEgypt, Arab Rep.El SalvadorEquatorial GuineaEritreaEstoniaEthiopiaEuro areaEurope & Central AsiaEurope & Central Asia (excluding high income)Europe & Central Asia (IDA & IBRD countries)European UnionFaroe IslandsFijiFinlandFragile and conflict affected situationsFranceGabonGambia, TheGeorgiaGermanyGhanaGreeceGrenadaGuatemalaGuineaGuinea-BissauGuyanaHaitiHeavily indebted poor countries (HIPC)High incomeHondurasHong Kong SAR, ChinaHungaryIBRD onlyIcelandIDA & IBRD totalIDA blendIDA onlyIDA totalIndiaIndonesiaIran, Islamic Rep.IraqIrelandIsraelItalyJamaicaJapanJordanKazakhstanKenyaKiribatiKorea, Rep.KosovoKuwaitKyrgyz RepublicLao PDRLate-demographic dividendLatin America & Caribbean Latin America & Caribbean (excluding high income)Latin America & the Caribbean (IDA & IBRD countries)LatviaLeast developed countries: UN classificationLebanonLesothoLiberiaLibyaLithuaniaLow & middle incomeLow incomeLower middle incomeLuxembourgMacao SAR, ChinaMacedonia, FYRMadagascarMalawiMalaysiaMaldivesMaliMaltaMauritaniaMauritiusMexicoMiddle East & North AfricaMiddle East & North Africa (excluding high income)Middle East & North Africa (IDA & IBRD countries)Middle incomeMoldovaMongoliaMontenegroMoroccoMozambiqueNamibiaNepalNetherlandsNew ZealandNicaraguaNigerNigeriaNorth AmericaNorwayOECD membersOmanOther small statesPacific island small statesPakistanPanamaPapua New GuineaParaguayPeruPhilippinesPolandPortugalPost-demographic dividendPre-demographic dividendQatarRomaniaRussian FederationRwandaSaudi ArabiaSenegalSerbiaSeychellesSierra LeoneSingaporeSlovak RepublicSloveniaSmall statesSolomon IslandsSouth AfricaSouth AsiaSouth Asia (IDA & IBRD)South SudanSpainSri LankaSt. Kitts and NevisSt. LuciaSt. Vincent and the GrenadinesSub-Saharan Africa Sub-Saharan Africa (excluding high income)Sub-Saharan Africa (IDA & IBRD countries)SudanSurinameSwazilandSwedenSwitzerlandSyrian Arab RepublicTajikistanTanzaniaThailandTimor-LesteTogoTongaTrinidad and TobagoTunisiaTurkeyUgandaUkraineUnited KingdomUnited StatesUpper middle incomeUruguayVanuatuVenezuela, RBVietnamWest Bank and GazaWorldYemen, Rep.ZambiaZimbabwe La ligne de temps
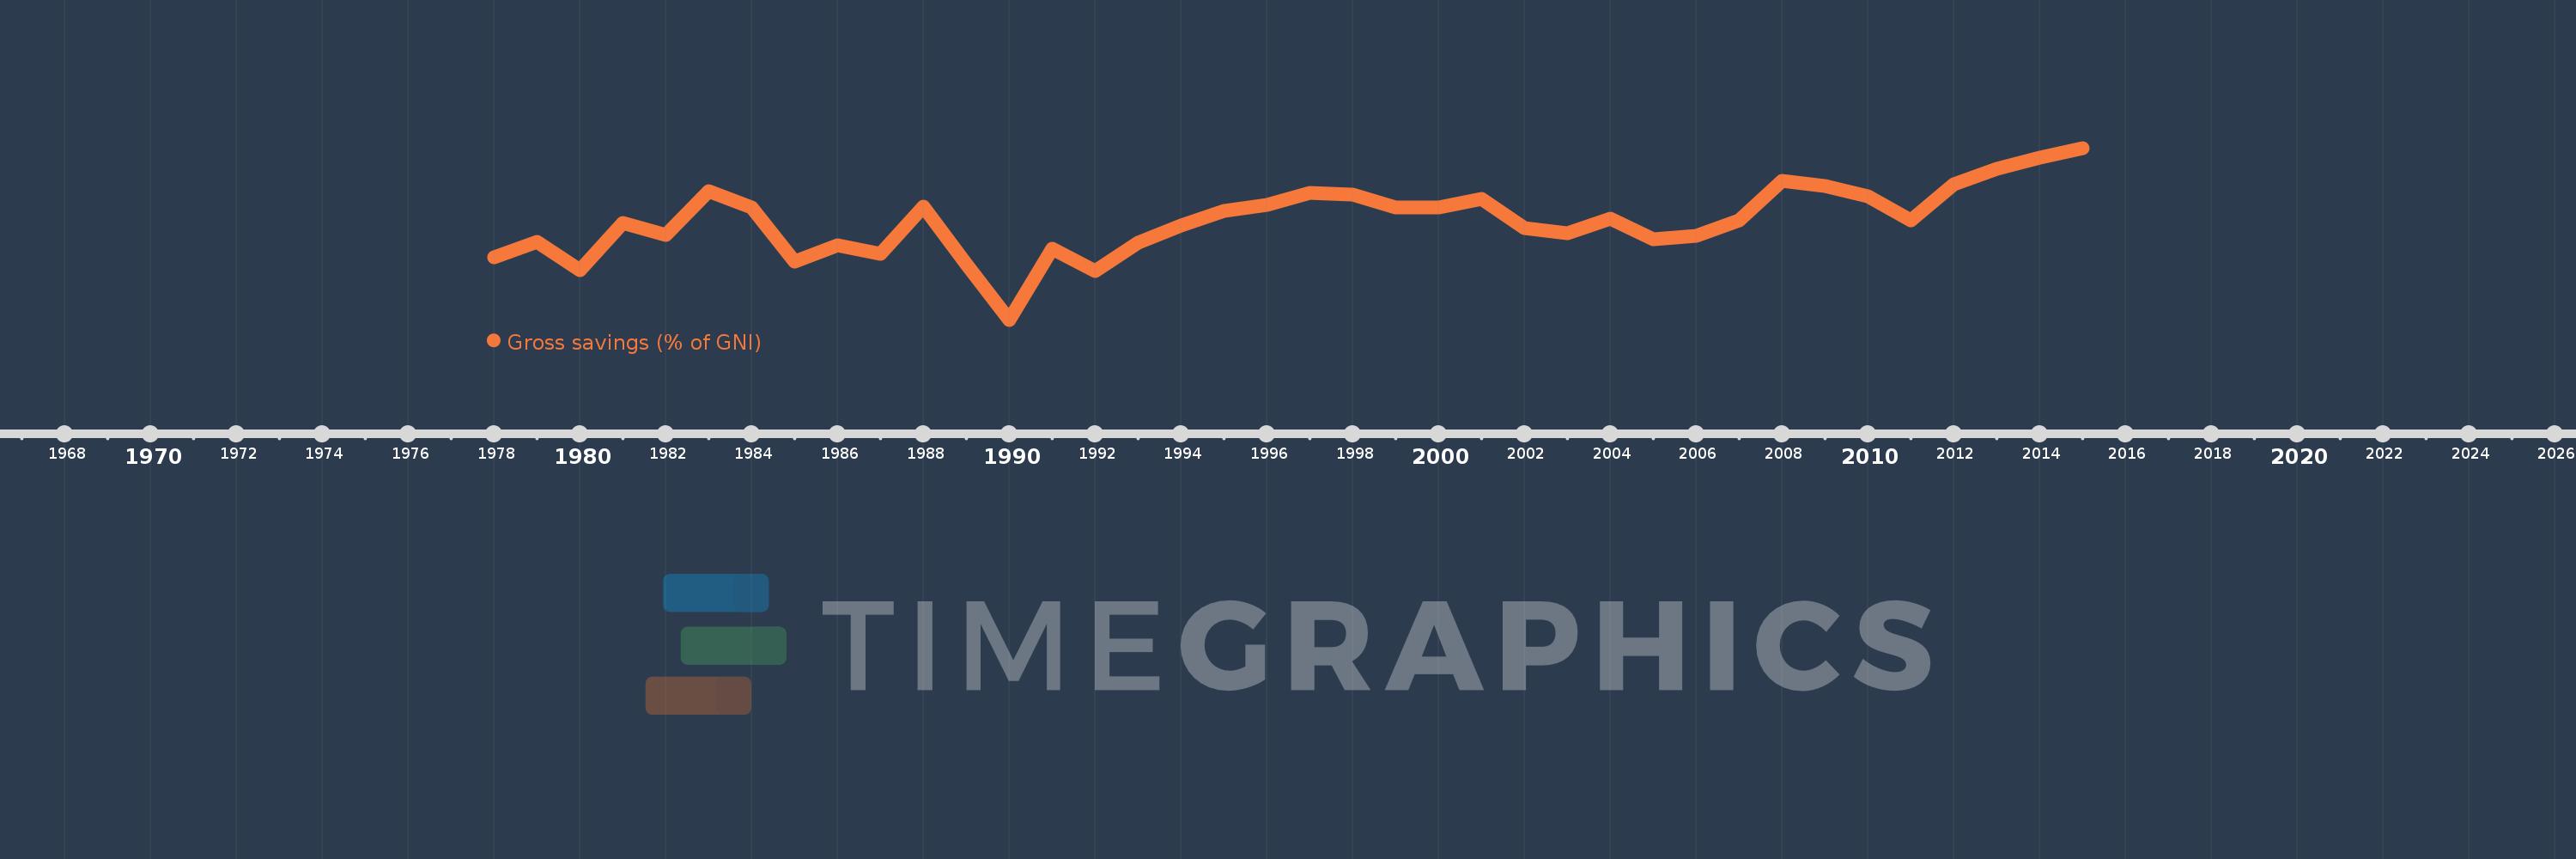
Cette échelle de temps montre un graphique de 1978 année à 2015 année Panama. Les données jusqu'à 1977 année ne sont pas présentés. Quantité d'observations actuelles selon dates: 38.
Source (désignation):
Les indicateurs du développement mondiale
Source (organisation):
World Bank national accounts data, and OECD National Accounts data files.
Catégories:
Economy & Growth
Dernière mise à jour
23 avr. 2017
Les indicateurs de changement de valeurs selon les années
Minimum:
0.368
1 janv. 1990
Maximum:
35.447
1 janv. 2015
Pour la date d''observation
Valeur
Changement absolu
Le changement par rapport à la valeur précédente
1 janv. 1978
13.114
+13.114
0.0%
1 janv. 1979
16.193
+3.079
23.48%
1 janv. 1980
10.544
-5.649
-34.88%
1 janv. 1981
20.144
+9.6
91.05%
1 janv. 1982
17.685
-2.459
-12.21%
1 janv. 1983
26.626
+8.941
50.56%
1 janv. 1984
23.297
-3.33
-12.5%
1 janv. 1985
12.188
-11.108
-47.68%
1 janv. 1986
15.506
+3.317
27.22%
1 janv. 1987
13.907
-1.599
-10.31%
1 janv. 1988
23.424
+9.517
68.43%
1 janv. 1989
11.705
-11.719
-50.03%
1 janv. 1990
0.368
-11.337
-96.86%
1 janv. 1991
14.843
+14.475
3.93 milles%
1 janv. 1992
10.27
-4.573
-30.81%
1 janv. 1993
16.14
+5.87
57.15%
1 janv. 1994
19.683
+3.543
21.95%
1 janv. 1995
22.604
+2.921
14.84%
1 janv. 1996
23.895
+1.291
5.71%
1 janv. 1997
26.233
+2.338
9.78%
1 janv. 1998
25.943
-0.29
-1.11%
1 janv. 1999
23.324
-2.618
-10.09%
1 janv. 2000
23.282
-0.042
-0.18%
1 janv. 2001
25.024
+1.742
7.48%
1 janv. 2002
19.061
-5.964
-23.83%
1 janv. 2003
18.116
-0.944
-4.95%
1 janv. 2004
21.093
+2.976
16.43%
1 janv. 2005
16.852
-4.24
-20.1%
1 janv. 2006
17.535
+0.683
4.05%
1 janv. 2007
20.682
+3.146
17.94%
1 janv. 2008
28.697
+8.015
38.75%
1 janv. 2009
27.719
-0.978
-3.41%
1 janv. 2010
25.541
-2.178
-7.86%
1 janv. 2011
20.678
-4.863
-19.04%
1 janv. 2012
27.998
+7.32
35.4%
1 janv. 2013
31.214
+3.217
11.49%
1 janv. 2014
33.498
+2.283
7.31%
1 janv. 2015
35.447
+1.95
5.82%
Classement des pays selon les statistiques actuelles par années


Commentaires: