29
/fr/
fr
AIzaSyAYiBZKx7MnpbEhh9jyipgxe19OcubqV5w
April 1, 2024
32662
Europe & Central Asia (IDA & IBRD countries)
TEC
false
2
1
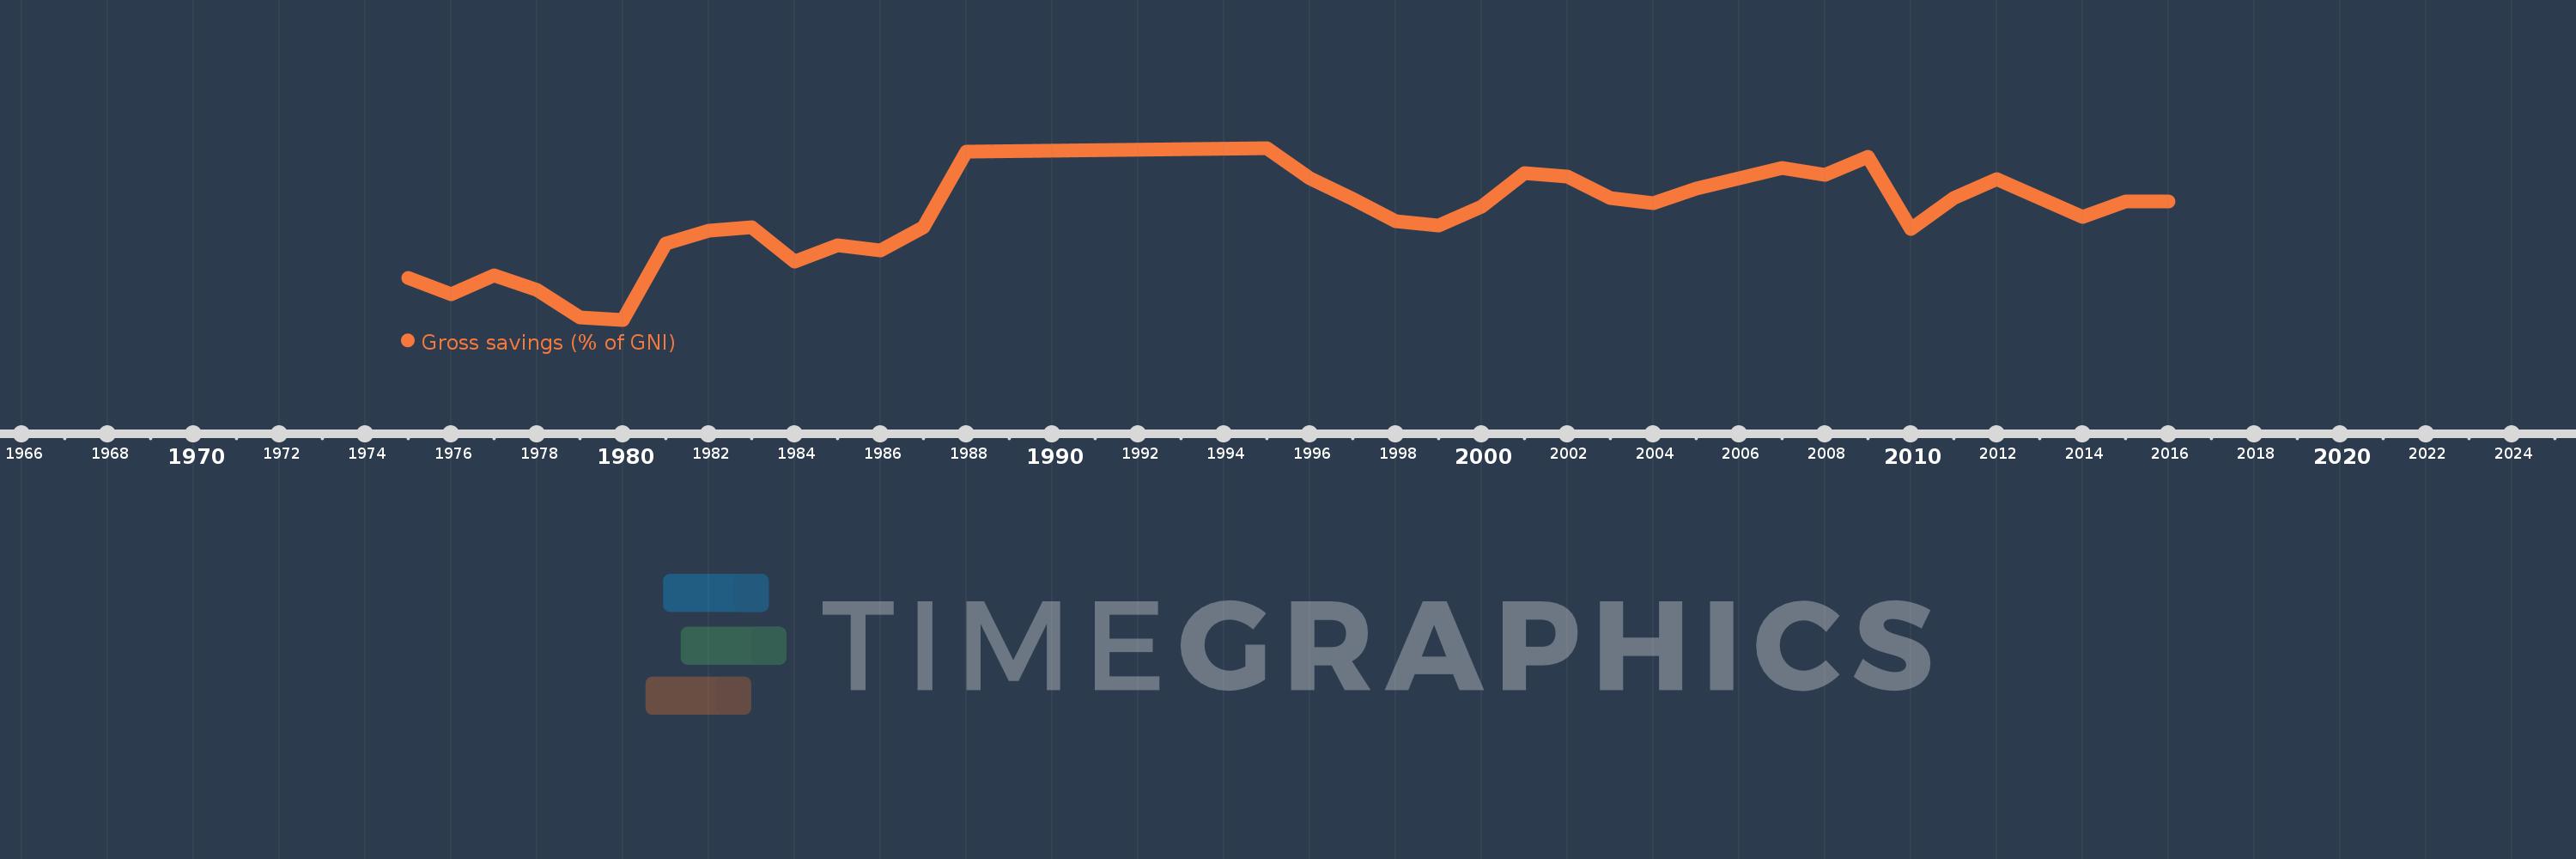
Gross savings (% of GNI)
2016,2015,2014,2013,2012,2011,2010,2009,2008,2007,2006,2005,2004,2003,2002,2001,2000,1999,1998,1997,1996,1995,1988,1987,1986,1985,1984,1983,1982,1981,1980,1979,1978,1977,1976,1975
Cette statistique dans les autres pays:
AfghanistanAlbaniaAlgeriaAngolaAntigua and BarbudaArab WorldArgentinaArmeniaAustraliaAustriaAzerbaijanBahamas, TheBahrainBangladeshBarbadosBelarusBelgiumBelizeBeninBermudaBhutanBoliviaBosnia and HerzegovinaBotswanaBrazilBrunei DarussalamBulgariaBurkina FasoBurundiCabo VerdeCambodiaCameroonCanadaCaribbean small statesCentral African RepublicCentral Europe and the BalticsChadChileChinaColombiaComorosCongo, Dem. Rep.Congo, Rep.Costa RicaCote d'IvoireCroatiaCyprusCzech RepublicDenmarkDjiboutiDominicaDominican RepublicEarly-demographic dividendEast Asia & PacificEast Asia & Pacific (excluding high income)East Asia & Pacific (IDA & IBRD countries)EcuadorEgypt, Arab Rep.El SalvadorEquatorial GuineaEritreaEstoniaEthiopiaEuro areaEurope & Central AsiaEurope & Central Asia (excluding high income)Europe & Central Asia (IDA & IBRD countries)European UnionFaroe IslandsFijiFinlandFragile and conflict affected situationsFranceGabonGambia, TheGeorgiaGermanyGhanaGreeceGrenadaGuatemalaGuineaGuinea-BissauGuyanaHaitiHeavily indebted poor countries (HIPC)High incomeHondurasHong Kong SAR, ChinaHungaryIBRD onlyIcelandIDA & IBRD totalIDA blendIDA onlyIDA totalIndiaIndonesiaIran, Islamic Rep.IraqIrelandIsraelItalyJamaicaJapanJordanKazakhstanKenyaKiribatiKorea, Rep.KosovoKuwaitKyrgyz RepublicLao PDRLate-demographic dividendLatin America & Caribbean Latin America & Caribbean (excluding high income)Latin America & the Caribbean (IDA & IBRD countries)LatviaLeast developed countries: UN classificationLebanonLesothoLiberiaLibyaLithuaniaLow & middle incomeLow incomeLower middle incomeLuxembourgMacao SAR, ChinaMacedonia, FYRMadagascarMalawiMalaysiaMaldivesMaliMaltaMauritaniaMauritiusMexicoMiddle East & North AfricaMiddle East & North Africa (excluding high income)Middle East & North Africa (IDA & IBRD countries)Middle incomeMoldovaMongoliaMontenegroMoroccoMozambiqueNamibiaNepalNetherlandsNew ZealandNicaraguaNigerNigeriaNorth AmericaNorwayOECD membersOmanOther small statesPacific island small statesPakistanPanamaPapua New GuineaParaguayPeruPhilippinesPolandPortugalPost-demographic dividendPre-demographic dividendQatarRomaniaRussian FederationRwandaSaudi ArabiaSenegalSerbiaSeychellesSierra LeoneSingaporeSlovak RepublicSloveniaSmall statesSolomon IslandsSouth AfricaSouth AsiaSouth Asia (IDA & IBRD)South SudanSpainSri LankaSt. Kitts and NevisSt. LuciaSt. Vincent and the GrenadinesSub-Saharan Africa Sub-Saharan Africa (excluding high income)Sub-Saharan Africa (IDA & IBRD countries)SudanSurinameSwazilandSwedenSwitzerlandSyrian Arab RepublicTajikistanTanzaniaThailandTimor-LesteTogoTongaTrinidad and TobagoTunisiaTurkeyUgandaUkraineUnited KingdomUnited StatesUpper middle incomeUruguayVanuatuVenezuela, RBVietnamWest Bank and GazaWorldYemen, Rep.ZambiaZimbabwe La ligne de temps
Cette échelle de temps montre un graphique de 1975 année à 2016 année Europe & Central Asia (IDA & IBRD countries). Les données jusqu'à 1974 année ne sont pas présentés. Quantité d'observations actuelles selon dates: 36.
Source (désignation):
Les indicateurs du développement mondiale
Source (organisation):
World Bank national accounts data, and OECD National Accounts data files.
Catégories:
Economy & Growth
Dernière mise à jour
23 avr. 2017
Les indicateurs de changement de valeurs selon les années
Minimum:
12.879
1 janv. 1980
Maximum:
26.209
1 janv. 1995
Pour la date d''observation
Valeur
Changement absolu
Le changement par rapport à la valeur précédente
1 janv. 1975
16.106
+16.106
0.0%
1 janv. 1976
14.881
-1.225
-7.61%
1 janv. 1977
16.345
+1.464
9.84%
1 janv. 1978
15.195
-1.149
-7.03%
1 janv. 1979
13.037
-2.158
-14.2%
1 janv. 1980
12.879
-0.158
-1.21%
1 janv. 1981
18.765
+5.886
45.7%
1 janv. 1982
19.782
+1.017
5.42%
1 janv. 1983
20.035
+0.253
1.28%
1 janv. 1984
17.421
-2.614
-13.05%
1 janv. 1985
18.663
+1.242
7.13%
1 janv. 1986
18.231
-0.432
-2.32%
1 janv. 1987
20.071
+1.84
10.09%
1 janv. 1988
25.955
+5.885
29.32%
1 janv. 1995
26.209
+0.254
0.98%
1 janv. 1996
23.853
-2.356
-8.99%
1 janv. 1997
22.268
-1.585
-6.64%
1 janv. 1998
20.512
-1.757
-7.89%
1 janv. 1999
20.21
-0.302
-1.47%
1 janv. 2000
21.648
+1.438
7.11%
1 janv. 2001
24.287
+2.639
12.19%
1 janv. 2002
23.985
-0.302
-1.24%
1 janv. 2003
22.351
-1.634
-6.81%
1 janv. 2004
21.928
-0.423
-1.89%
1 janv. 2005
23.072
+1.144
5.22%
1 janv. 2006
23.849
+0.777
3.37%
1 janv. 2007
24.66
+0.811
3.4%
1 janv. 2008
24.097
-0.563
-2.28%
1 janv. 2009
25.52
+1.423
5.91%
1 janv. 2010
19.915
-5.605
-21.96%
1 janv. 2011
22.339
+2.424
12.17%
1 janv. 2012
23.818
+1.48
6.62%
1 janv. 2013
22.335
-1.483
-6.23%
1 janv. 2014
20.878
-1.457
-6.52%
1 janv. 2015
22.06
+1.182
5.66%
1 janv. 2016
22.042
-0.018
-0.08%
Classement des pays selon les statistiques actuelles par années


Commentaires: