29
/fr/
fr
AIzaSyAYiBZKx7MnpbEhh9jyipgxe19OcubqV5w
April 1, 2024
281051
Venezuela, RB
VEN
true
2
1
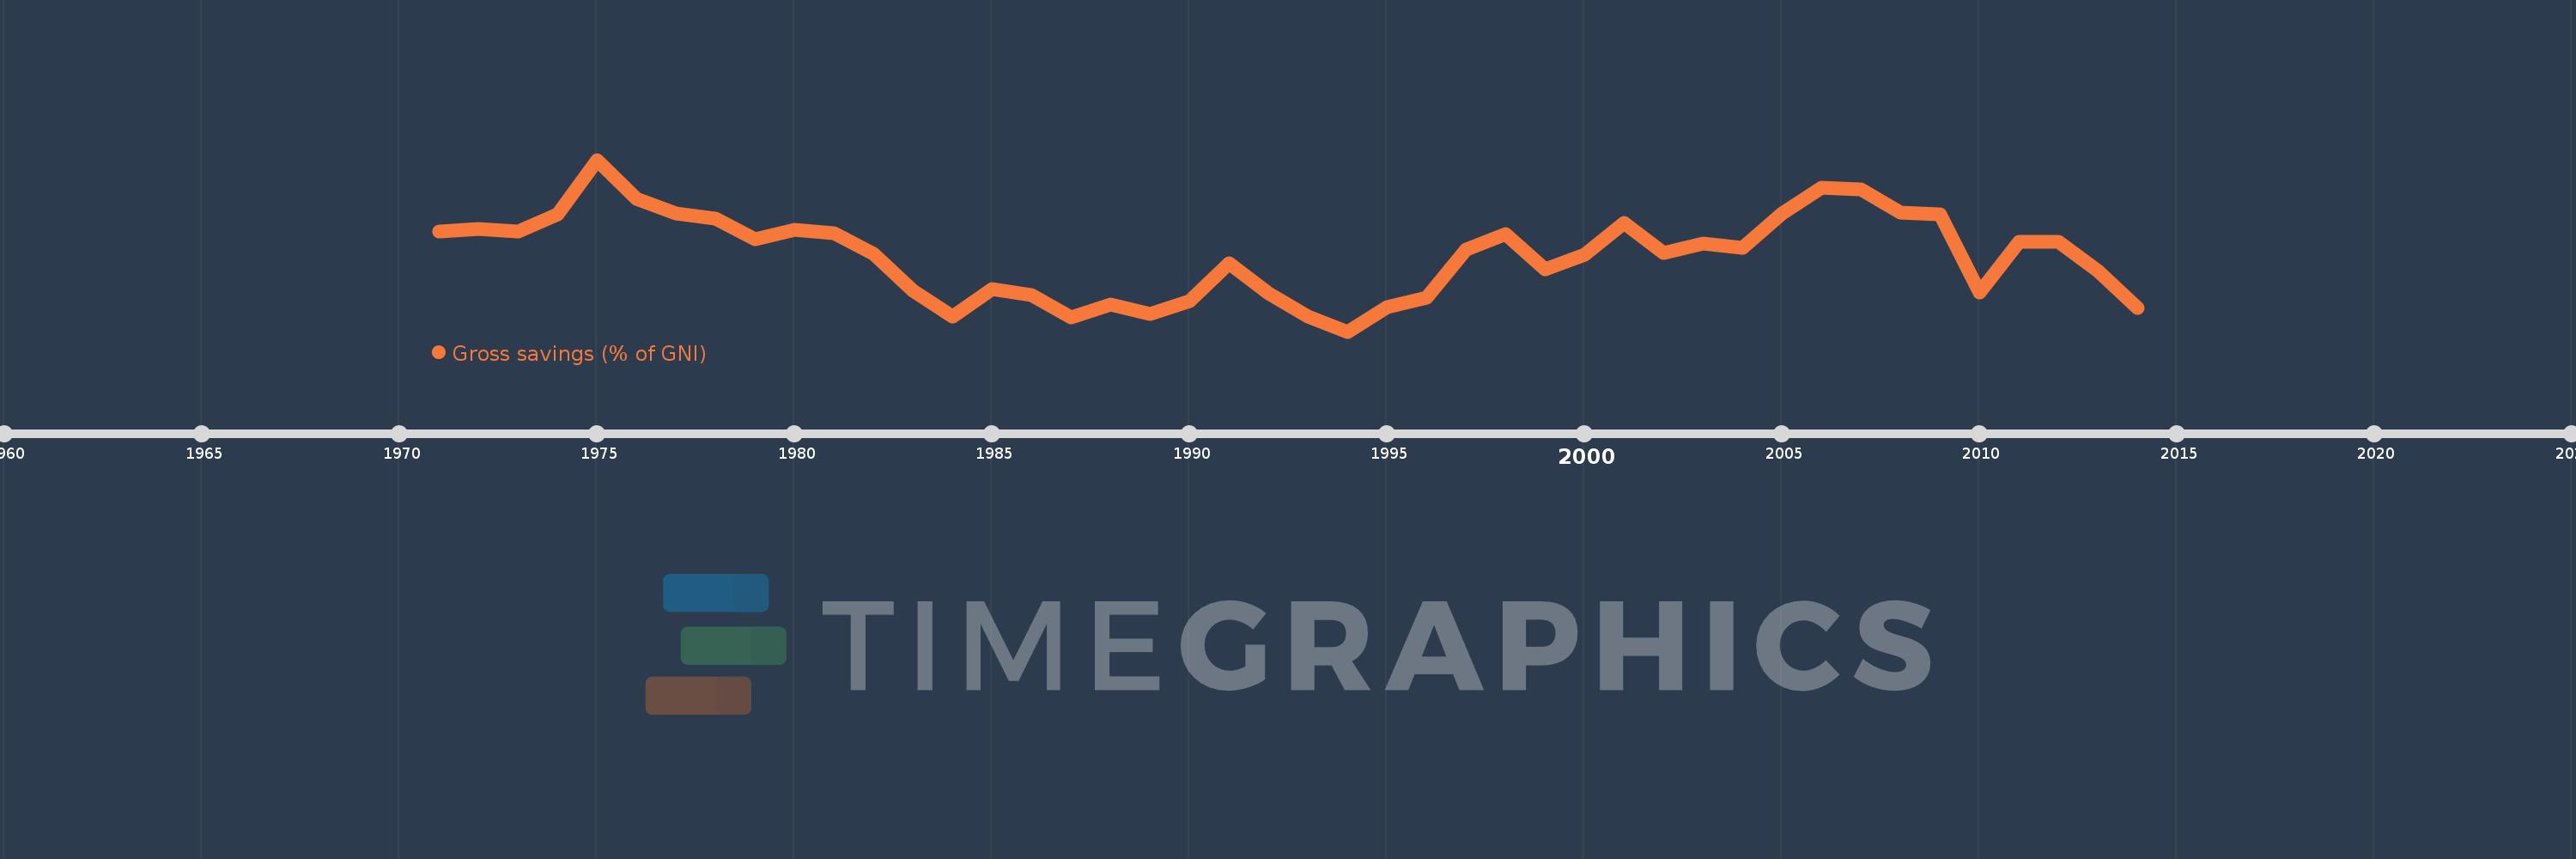
Gross savings (% of GNI)
2014,2013,2012,2011,2010,2009,2008,2007,2006,2005,2004,2003,2002,2001,2000,1999,1998,1997,1996,1995,1994,1993,1992,1991,1990,1989,1988,1987,1986,1985,1984,1983,1982,1981,1980,1979,1978,1977,1976,1975,1974,1973,1972,1971
Cette statistique dans les autres pays:
AfghanistanAlbaniaAlgeriaAngolaAntigua and BarbudaArab WorldArgentinaArmeniaAustraliaAustriaAzerbaijanBahamas, TheBahrainBangladeshBarbadosBelarusBelgiumBelizeBeninBermudaBhutanBoliviaBosnia and HerzegovinaBotswanaBrazilBrunei DarussalamBulgariaBurkina FasoBurundiCabo VerdeCambodiaCameroonCanadaCaribbean small statesCentral African RepublicCentral Europe and the BalticsChadChileChinaColombiaComorosCongo, Dem. Rep.Congo, Rep.Costa RicaCote d'IvoireCroatiaCyprusCzech RepublicDenmarkDjiboutiDominicaDominican RepublicEarly-demographic dividendEast Asia & PacificEast Asia & Pacific (excluding high income)East Asia & Pacific (IDA & IBRD countries)EcuadorEgypt, Arab Rep.El SalvadorEquatorial GuineaEritreaEstoniaEthiopiaEuro areaEurope & Central AsiaEurope & Central Asia (excluding high income)Europe & Central Asia (IDA & IBRD countries)European UnionFaroe IslandsFijiFinlandFragile and conflict affected situationsFranceGabonGambia, TheGeorgiaGermanyGhanaGreeceGrenadaGuatemalaGuineaGuinea-BissauGuyanaHaitiHeavily indebted poor countries (HIPC)High incomeHondurasHong Kong SAR, ChinaHungaryIBRD onlyIcelandIDA & IBRD totalIDA blendIDA onlyIDA totalIndiaIndonesiaIran, Islamic Rep.IraqIrelandIsraelItalyJamaicaJapanJordanKazakhstanKenyaKiribatiKorea, Rep.KosovoKuwaitKyrgyz RepublicLao PDRLate-demographic dividendLatin America & Caribbean Latin America & Caribbean (excluding high income)Latin America & the Caribbean (IDA & IBRD countries)LatviaLeast developed countries: UN classificationLebanonLesothoLiberiaLibyaLithuaniaLow & middle incomeLow incomeLower middle incomeLuxembourgMacao SAR, ChinaMacedonia, FYRMadagascarMalawiMalaysiaMaldivesMaliMaltaMauritaniaMauritiusMexicoMiddle East & North AfricaMiddle East & North Africa (excluding high income)Middle East & North Africa (IDA & IBRD countries)Middle incomeMoldovaMongoliaMontenegroMoroccoMozambiqueNamibiaNepalNetherlandsNew ZealandNicaraguaNigerNigeriaNorth AmericaNorwayOECD membersOmanOther small statesPacific island small statesPakistanPanamaPapua New GuineaParaguayPeruPhilippinesPolandPortugalPost-demographic dividendPre-demographic dividendQatarRomaniaRussian FederationRwandaSaudi ArabiaSenegalSerbiaSeychellesSierra LeoneSingaporeSlovak RepublicSloveniaSmall statesSolomon IslandsSouth AfricaSouth AsiaSouth Asia (IDA & IBRD)South SudanSpainSri LankaSt. Kitts and NevisSt. LuciaSt. Vincent and the GrenadinesSub-Saharan Africa Sub-Saharan Africa (excluding high income)Sub-Saharan Africa (IDA & IBRD countries)SudanSurinameSwazilandSwedenSwitzerlandSyrian Arab RepublicTajikistanTanzaniaThailandTimor-LesteTogoTongaTrinidad and TobagoTunisiaTurkeyUgandaUkraineUnited KingdomUnited StatesUpper middle incomeUruguayVanuatuVenezuela, RBVietnamWest Bank and GazaWorldYemen, Rep.ZambiaZimbabwe La ligne de temps
Cette échelle de temps montre un graphique de 1971 année à 2014 année Venezuela, RB. Les données jusqu'à 1970 année ne sont pas présentés. Quantité d'observations actuelles selon dates: 44.
Source (désignation):
Les indicateurs du développement mondiale
Source (organisation):
World Bank national accounts data, and OECD National Accounts data files.
Catégories:
Economy & Growth
Dernière mise à jour
23 avr. 2017
Les indicateurs de changement de valeurs selon les années
Minimum:
15.398
1 janv. 1994
Maximum:
46.274
1 janv. 1975
Pour la date d''observation
Valeur
Changement absolu
Le changement par rapport à la valeur précédente
1 janv. 1971
33.351
+33.351
0.0%
1 janv. 1972
33.801
+0.45
1.35%
1 janv. 1973
33.447
-0.354
-1.05%
1 janv. 1974
36.489
+3.042
9.1%
1 janv. 1975
46.274
+9.785
26.82%
1 janv. 1976
39.324
-6.949
-15.02%
1 janv. 1977
36.601
-2.724
-6.93%
1 janv. 1978
35.726
-0.875
-2.39%
1 janv. 1979
31.947
-3.779
-10.58%
1 janv. 1980
33.758
+1.811
5.67%
1 janv. 1981
33.018
-0.74
-2.19%
1 janv. 1982
29.347
-3.671
-11.12%
1 janv. 1983
22.697
-6.65
-22.66%
1 janv. 1984
18.044
-4.653
-20.5%
1 janv. 1985
23.009
+4.965
27.52%
1 janv. 1986
21.895
-1.113
-4.84%
1 janv. 1987
17.947
-3.949
-18.04%
1 janv. 1988
20.201
+2.254
12.56%
1 janv. 1989
18.502
-1.699
-8.41%
1 janv. 1990
20.855
+2.352
12.71%
1 janv. 1991
27.653
+6.798
32.6%
1 janv. 1992
22.202
-5.451
-19.71%
1 janv. 1993
18.079
-4.122
-18.57%
1 janv. 1994
15.398
-2.681
-14.83%
1 janv. 1995
19.873
+4.475
29.06%
1 janv. 1996
21.514
+1.641
8.26%
1 janv. 1997
30.179
+8.665
40.28%
1 janv. 1998
32.864
+2.685
8.9%
1 janv. 1999
26.647
-6.217
-18.92%
1 janv. 2000
29.151
+2.504
9.4%
1 janv. 2001
34.885
+5.734
19.67%
1 janv. 2002
29.576
-5.309
-15.22%
1 janv. 2003
31.241
+1.665
5.63%
1 janv. 2004
30.427
-0.815
-2.61%
1 janv. 2005
36.698
+6.272
20.61%
1 janv. 2006
41.263
+4.564
12.44%
1 janv. 2007
40.915
-0.348
-0.84%
1 janv. 2008
36.82
-4.095
-10.01%
1 janv. 2009
36.442
-0.377
-1.02%
1 janv. 2010
22.389
-14.054
-38.56%
1 janv. 2011
31.572
+9.183
41.02%
1 janv. 2012
31.526
-0.046
-0.15%
1 janv. 2013
26.331
-5.195
-16.48%
1 janv. 2014
19.642
-6.689
-25.4%
Classement des pays selon les statistiques actuelles par années


Commentaires: