29
/fr/
fr
AIzaSyAYiBZKx7MnpbEhh9jyipgxe19OcubqV5w
April 1, 2024
30212
Euro area
EMU
false
2
1
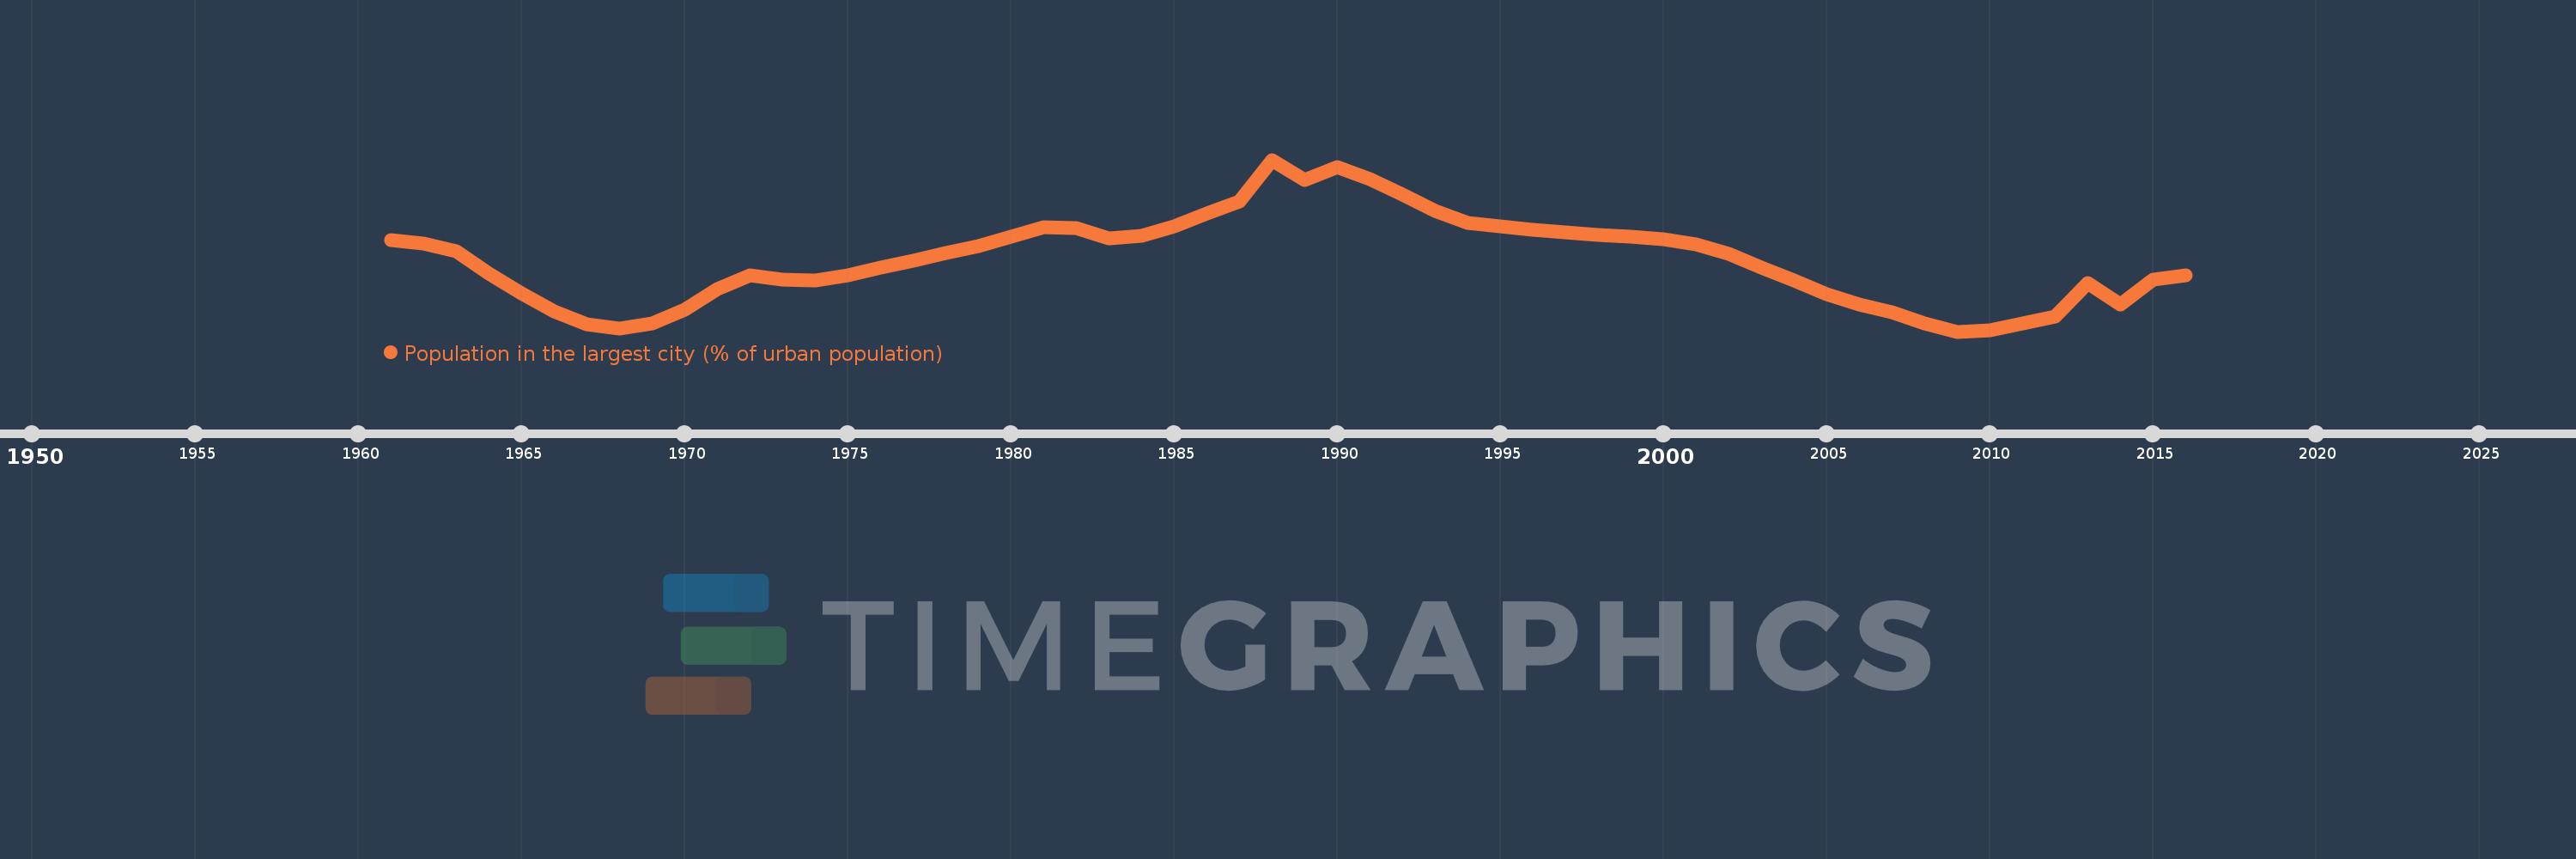
Population in the largest city (% of urban population)
2016,2015,2014,2013,2012,2011,2010,2009,2008,2007,2006,2005,2004,2003,2002,2001,2000,1999,1998,1997,1996,1995,1994,1993,1992,1991,1990,1989,1988,1987,1986,1985,1984,1983,1982,1981,1980,1979,1978,1977,1976,1975,1974,1973,1972,1971,1970,1969,1968,1967,1966,1965,1964,1963,1962,1961
Cette statistique dans les autres pays:
AfghanistanAlbaniaAlgeriaAngolaArab WorldArgentinaArmeniaAustraliaAustriaAzerbaijanBahrainBangladeshBelarusBelgiumBeninBoliviaBosnia and HerzegovinaBrazilBulgariaBurkina FasoBurundiCambodiaCameroonCanadaCentral African RepublicCentral Europe and the BalticsChadChileChinaColombiaCongo, Dem. Rep.Congo, Rep.Costa RicaCote d'IvoireCroatiaCubaCzech RepublicDenmarkDjiboutiDominican RepublicEarly-demographic dividendEast Asia & PacificEast Asia & Pacific (excluding high income)East Asia & Pacific (IDA & IBRD countries)EcuadorEgypt, Arab Rep.El SalvadorEritreaEstoniaEthiopiaEuro areaEurope & Central AsiaEurope & Central Asia (excluding high income)Europe & Central Asia (IDA & IBRD countries)European UnionFinlandFragile and conflict affected situationsFranceGabonGambia, TheGeorgiaGermanyGhanaGreeceGuatemalaGuineaGuinea-BissauHaitiHeavily indebted poor countries (HIPC)High incomeHondurasHong Kong SAR, ChinaHungaryIBRD onlyIDA & IBRD totalIDA blendIDA onlyIDA totalIndiaIndonesiaIran, Islamic Rep.IraqIrelandIsraelItalyJamaicaJapanJordanKazakhstanKenyaKorea, Dem. People’s Rep.Korea, Rep.KuwaitKyrgyz RepublicLao PDRLate-demographic dividendLatin America & Caribbean Latin America & Caribbean (excluding high income)Latin America & the Caribbean (IDA & IBRD countries)LatviaLeast developed countries: UN classificationLebanonLiberiaLibyaLithuaniaLow & middle incomeLow incomeLower middle incomeMacao SAR, ChinaMacedonia, FYRMadagascarMalawiMalaysiaMaliMauritaniaMexicoMiddle East & North AfricaMiddle East & North Africa (excluding high income)Middle East & North Africa (IDA & IBRD countries)Middle incomeMoldovaMongoliaMoroccoMozambiqueMyanmarNamibiaNepalNetherlandsNew ZealandNicaraguaNigerNigeriaNorth AmericaNorwayOECD membersOmanPakistanPanamaPapua New GuineaParaguayPeruPhilippinesPolandPortugalPost-demographic dividendPre-demographic dividendPuerto RicoQatarRomaniaRussian FederationRwandaSaudi ArabiaSenegalSerbiaSierra LeoneSingaporeSlovak RepublicSomaliaSouth AfricaSouth AsiaSouth Asia (IDA & IBRD)South SudanSpainSri LankaSub-Saharan Africa Sub-Saharan Africa (excluding high income)Sub-Saharan Africa (IDA & IBRD countries)SudanSwedenSwitzerlandSyrian Arab RepublicTajikistanTanzaniaThailandTogoTunisiaTurkeyTurkmenistanUgandaUkraineUnited Arab EmiratesUnited KingdomUnited StatesUpper middle incomeUruguayUzbekistanVenezuela, RBVietnamWest Bank and GazaWorldYemen, Rep.ZambiaZimbabwe La ligne de temps
Cette échelle de temps montre un graphique de 1961 année à 2016 année Euro area. Les données jusqu'à 1960 année ne sont pas présentés. Quantité d'observations actuelles selon dates: 56.
Source (désignation):
Les indicateurs du développement mondiale
Source (organisation):
United Nations, World Urbanization Prospects.
Catégories:
Urban Development
Dernière mise à jour
23 avr. 2017
Les indicateurs de changement de valeurs selon les années
Minimum:
15.31
1 janv. 2009
Maximum:
15.78
1 janv. 1988
Pour la date d''observation
Valeur
Changement absolu
Le changement par rapport à la valeur précédente
1 janv. 1961
15.56
+15.56
0.0%
1 janv. 1962
15.55
-0.01
-0.06%
1 janv. 1963
15.53
-0.02
-0.13%
1 janv. 1964
15.468
-0.062
-0.4%
1 janv. 1965
15.415
-0.054
-0.35%
1 janv. 1966
15.366
-0.049
-0.32%
1 janv. 1967
15.331
-0.035
-0.23%
1 janv. 1968
15.319
-0.012
-0.08%
1 janv. 1969
15.333
+0.014
0.09%
1 janv. 1970
15.369
+0.036
0.24%
1 janv. 1971
15.426
+0.057
0.37%
1 janv. 1972
15.465
+0.039
0.25%
1 janv. 1973
15.452
-0.013
-0.09%
1 janv. 1974
15.451
-0.001
-0.01%
1 janv. 1975
15.465
+0.014
0.09%
1 janv. 1976
15.485
+0.02
0.13%
1 janv. 1977
15.503
+0.018
0.12%
1 janv. 1978
15.525
+0.022
0.14%
1 janv. 1979
15.544
+0.019
0.12%
1 janv. 1980
15.57
+0.026
0.17%
1 janv. 1981
15.595
+0.024
0.16%
1 janv. 1982
15.593
-0.001
-0.01%
1 janv. 1983
15.565
-0.028
-0.18%
1 janv. 1984
15.572
+0.007
0.04%
1 janv. 1985
15.599
+0.027
0.17%
1 janv. 1986
15.634
+0.035
0.23%
1 janv. 1987
15.665
+0.031
0.2%
1 janv. 1988
15.78
+0.115
0.73%
1 janv. 1989
15.724
-0.056
-0.35%
1 janv. 1990
15.76
+0.036
0.23%
1 janv. 1991
15.726
-0.034
-0.22%
1 janv. 1992
15.684
-0.042
-0.26%
1 janv. 1993
15.641
-0.043
-0.28%
1 janv. 1994
15.608
-0.033
-0.21%
1 janv. 1995
15.597
-0.011
-0.07%
1 janv. 1996
15.588
-0.009
-0.06%
1 janv. 1997
15.582
-0.006
-0.04%
1 janv. 1998
15.575
-0.007
-0.05%
1 janv. 1999
15.57
-0.005
-0.03%
1 janv. 2000
15.563
-0.007
-0.05%
1 janv. 2001
15.549
-0.014
-0.09%
1 janv. 2002
15.522
-0.027
-0.18%
1 janv. 2003
15.485
-0.036
-0.23%
1 janv. 2004
15.449
-0.037
-0.24%
1 janv. 2005
15.412
-0.037
-0.24%
1 janv. 2006
15.384
-0.028
-0.18%
1 janv. 2007
15.363
-0.021
-0.14%
1 janv. 2008
15.333
-0.03
-0.19%
1 janv. 2009
15.31
-0.023
-0.15%
1 janv. 2010
15.314
+0.004
0.03%
1 janv. 2011
15.332
+0.018
0.12%
1 janv. 2012
15.35
+0.018
0.12%
1 janv. 2013
15.443
+0.093
0.61%
1 janv. 2014
15.385
-0.058
-0.37%
1 janv. 2015
15.453
+0.067
0.44%
1 janv. 2016
15.463
+0.01
0.07%
Classement des pays selon les statistiques actuelles par années


Commentaires: