29
/fr/
fr
AIzaSyAYiBZKx7MnpbEhh9jyipgxe19OcubqV5w
April 1, 2024
140900
Ghana
GHA
true
2
1
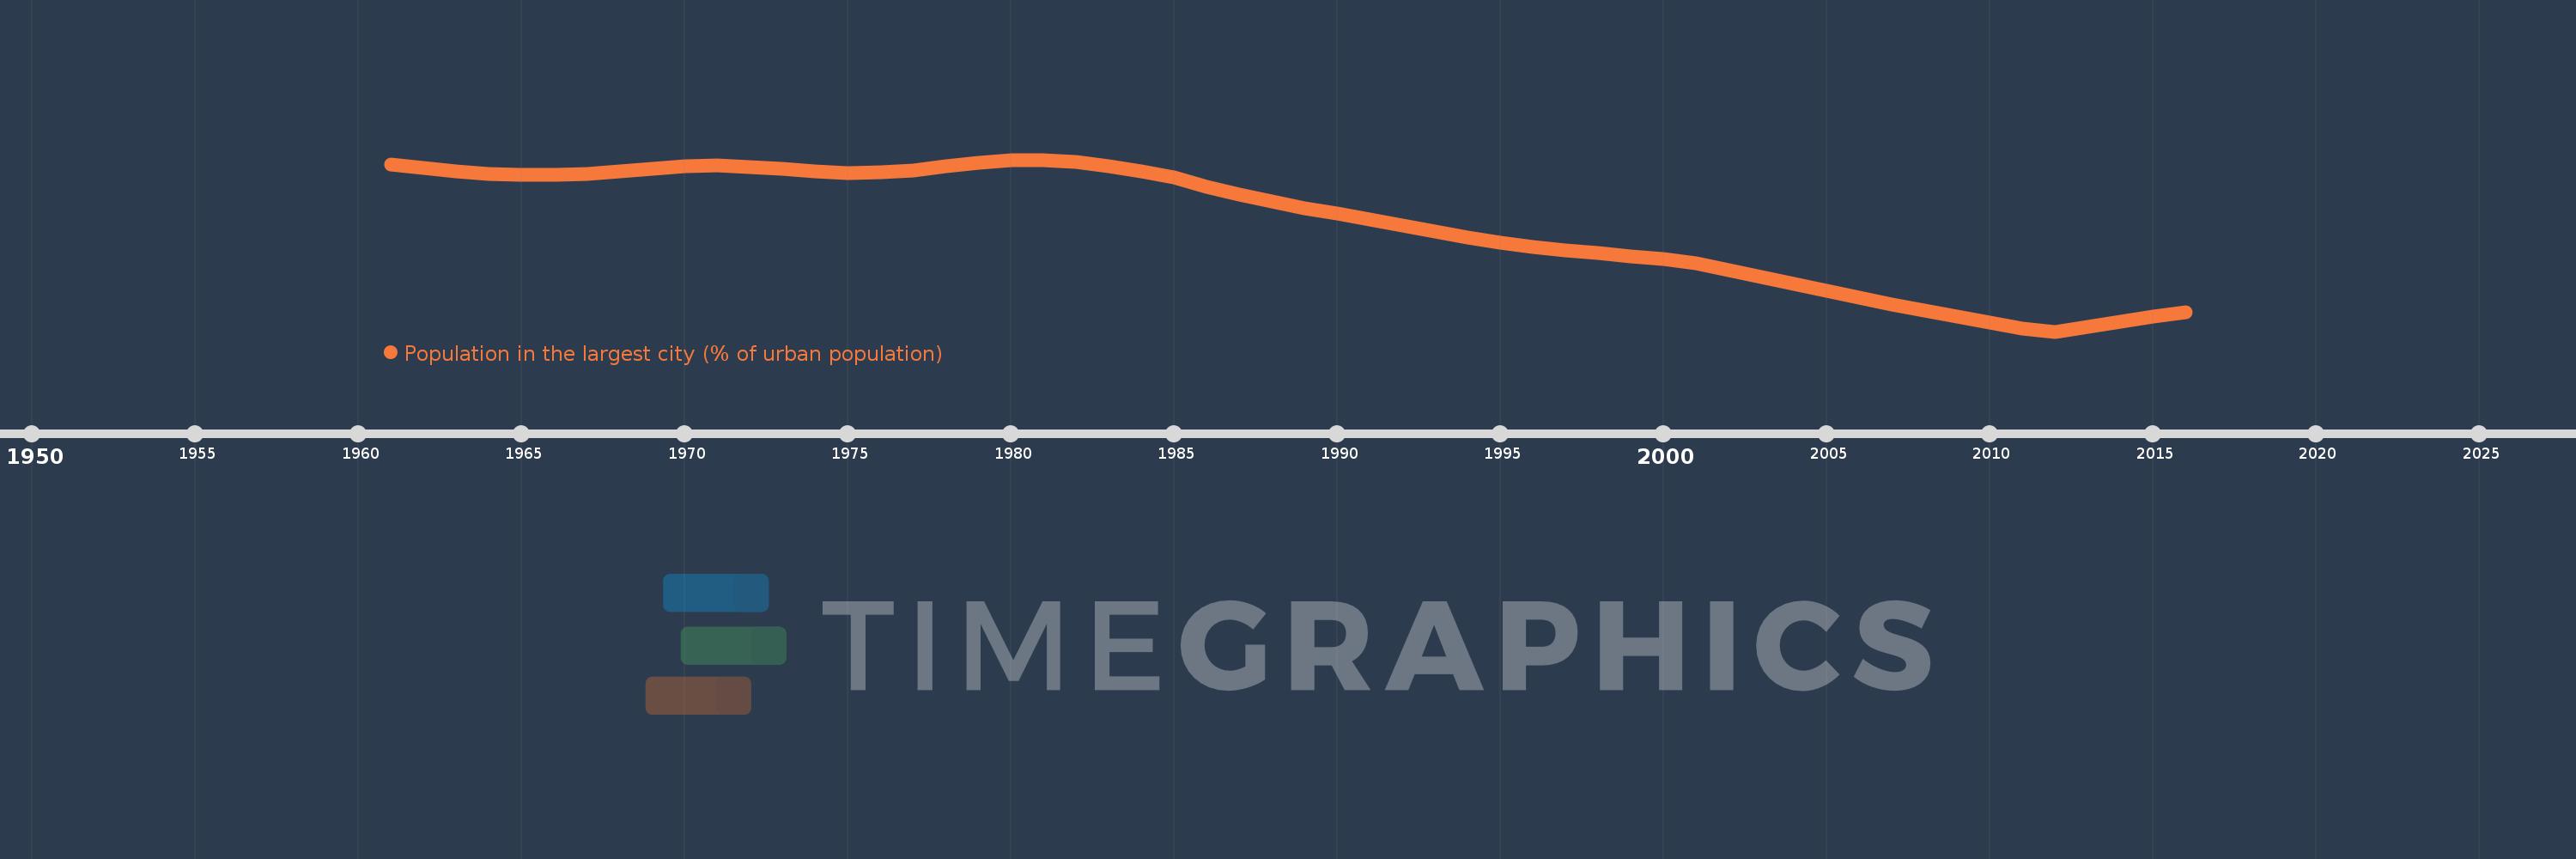
Population in the largest city (% of urban population)
2016,2015,2014,2013,2012,2011,2010,2009,2008,2007,2006,2005,2004,2003,2002,2001,2000,1999,1998,1997,1996,1995,1994,1993,1992,1991,1990,1989,1988,1987,1986,1985,1984,1983,1982,1981,1980,1979,1978,1977,1976,1975,1974,1973,1972,1971,1970,1969,1968,1967,1966,1965,1964,1963,1962,1961
Cette statistique dans les autres pays:
AfghanistanAlbaniaAlgeriaAngolaArab WorldArgentinaArmeniaAustraliaAustriaAzerbaijanBahrainBangladeshBelarusBelgiumBeninBoliviaBosnia and HerzegovinaBrazilBulgariaBurkina FasoBurundiCambodiaCameroonCanadaCentral African RepublicCentral Europe and the BalticsChadChileChinaColombiaCongo, Dem. Rep.Congo, Rep.Costa RicaCote d'IvoireCroatiaCubaCzech RepublicDenmarkDjiboutiDominican RepublicEarly-demographic dividendEast Asia & PacificEast Asia & Pacific (excluding high income)East Asia & Pacific (IDA & IBRD countries)EcuadorEgypt, Arab Rep.El SalvadorEritreaEstoniaEthiopiaEuro areaEurope & Central AsiaEurope & Central Asia (excluding high income)Europe & Central Asia (IDA & IBRD countries)European UnionFinlandFragile and conflict affected situationsFranceGabonGambia, TheGeorgiaGermanyGhanaGreeceGuatemalaGuineaGuinea-BissauHaitiHeavily indebted poor countries (HIPC)High incomeHondurasHong Kong SAR, ChinaHungaryIBRD onlyIDA & IBRD totalIDA blendIDA onlyIDA totalIndiaIndonesiaIran, Islamic Rep.IraqIrelandIsraelItalyJamaicaJapanJordanKazakhstanKenyaKorea, Dem. People’s Rep.Korea, Rep.KuwaitKyrgyz RepublicLao PDRLate-demographic dividendLatin America & Caribbean Latin America & Caribbean (excluding high income)Latin America & the Caribbean (IDA & IBRD countries)LatviaLeast developed countries: UN classificationLebanonLiberiaLibyaLithuaniaLow & middle incomeLow incomeLower middle incomeMacao SAR, ChinaMacedonia, FYRMadagascarMalawiMalaysiaMaliMauritaniaMexicoMiddle East & North AfricaMiddle East & North Africa (excluding high income)Middle East & North Africa (IDA & IBRD countries)Middle incomeMoldovaMongoliaMoroccoMozambiqueMyanmarNamibiaNepalNetherlandsNew ZealandNicaraguaNigerNigeriaNorth AmericaNorwayOECD membersOmanPakistanPanamaPapua New GuineaParaguayPeruPhilippinesPolandPortugalPost-demographic dividendPre-demographic dividendPuerto RicoQatarRomaniaRussian FederationRwandaSaudi ArabiaSenegalSerbiaSierra LeoneSingaporeSlovak RepublicSomaliaSouth AfricaSouth AsiaSouth Asia (IDA & IBRD)South SudanSpainSri LankaSub-Saharan Africa Sub-Saharan Africa (excluding high income)Sub-Saharan Africa (IDA & IBRD countries)SudanSwedenSwitzerlandSyrian Arab RepublicTajikistanTanzaniaThailandTogoTunisiaTurkeyTurkmenistanUgandaUkraineUnited Arab EmiratesUnited KingdomUnited StatesUpper middle incomeUruguayUzbekistanVenezuela, RBVietnamWest Bank and GazaWorldYemen, Rep.ZambiaZimbabwe La ligne de temps
Cette échelle de temps montre un graphique de 1961 année à 2016 année Ghana. Les données jusqu'à 1960 année ne sont pas présentés. Quantité d'observations actuelles selon dates: 56.
Source (désignation):
Les indicateurs du développement mondiale
Source (organisation):
United Nations, World Urbanization Prospects.
Catégories:
Urban Development
Dernière mise à jour
23 avr. 2017
Les indicateurs de changement de valeurs selon les années
Minimum:
16.535
1 janv. 2012
Maximum:
25.641
1 janv. 1981
Pour la date d''observation
Valeur
Changement absolu
Le changement par rapport à la valeur précédente
1 janv. 1961
25.38
+25.38
0.0%
1 janv. 1962
25.204
-0.176
-0.69%
1 janv. 1963
25.041
-0.163
-0.65%
1 janv. 1964
24.912
-0.13
-0.52%
1 janv. 1965
24.836
-0.076
-0.3%
1 janv. 1966
24.824
-0.012
-0.05%
1 janv. 1967
24.886
+0.062
0.25%
1 janv. 1968
25.009
+0.122
0.49%
1 janv. 1969
25.158
+0.149
0.6%
1 janv. 1970
25.282
+0.124
0.49%
1 janv. 1971
25.333
+0.051
0.2%
1 janv. 1972
25.27
-0.063
-0.25%
1 janv. 1973
25.153
-0.117
-0.46%
1 janv. 1974
25.028
-0.125
-0.5%
1 janv. 1975
24.958
-0.07
-0.28%
1 janv. 1976
24.974
+0.016
0.07%
1 janv. 1977
25.093
+0.119
0.48%
1 janv. 1978
25.283
+0.19
0.76%
1 janv. 1979
25.488
+0.206
0.81%
1 janv. 1980
25.625
+0.136
0.53%
1 janv. 1981
25.641
+0.016
0.06%
1 janv. 1982
25.522
-0.119
-0.46%
1 janv. 1983
25.304
-0.218
-0.85%
1 janv. 1984
25.036
-0.268
-1.06%
1 janv. 1985
24.694
-0.342
-1.37%
1 janv. 1986
24.204
-0.489
-1.98%
1 janv. 1987
23.786
-0.418
-1.73%
1 janv. 1988
23.42
-0.366
-1.54%
1 janv. 1989
23.09
-0.33
-1.41%
1 janv. 1990
22.773
-0.317
-1.37%
1 janv. 1991
22.458
-0.315
-1.38%
1 janv. 1992
22.14
-0.318
-1.41%
1 janv. 1993
21.83
-0.311
-1.4%
1 janv. 1994
21.534
-0.295
-1.35%
1 janv. 1995
21.269
-0.266
-1.23%
1 janv. 1996
21.039
-0.229
-1.08%
1 janv. 1997
20.847
-0.192
-0.91%
1 janv. 1998
20.683
-0.164
-0.79%
1 janv. 1999
20.535
-0.149
-0.72%
1 janv. 2000
20.386
-0.148
-0.72%
1 janv. 2001
20.173
-0.213
-1.05%
1 janv. 2002
19.799
-0.374
-1.85%
1 janv. 2003
19.423
-0.377
-1.9%
1 janv. 2004
19.047
-0.376
-1.93%
1 janv. 2005
18.678
-0.369
-1.94%
1 janv. 2006
18.32
-0.358
-1.92%
1 janv. 2007
17.973
-0.347
-1.89%
1 janv. 2008
17.637
-0.336
-1.87%
1 janv. 2009
17.313
-0.324
-1.84%
1 janv. 2010
17.002
-0.311
-1.8%
1 janv. 2011
16.705
-0.297
-1.75%
1 janv. 2012
16.535
-0.17
-1.02%
1 janv. 2013
16.79
+0.255
1.54%
1 janv. 2014
17.062
+0.272
1.62%
1 janv. 2015
17.352
+0.29
1.7%
1 janv. 2016
17.544
+0.192
1.11%
Classement des pays selon les statistiques actuelles par années


Commentaires: