29
/fr/
fr
AIzaSyAYiBZKx7MnpbEhh9jyipgxe19OcubqV5w
April 1, 2024
125316
Egypt, Arab Rep.
EGY
true
2
1
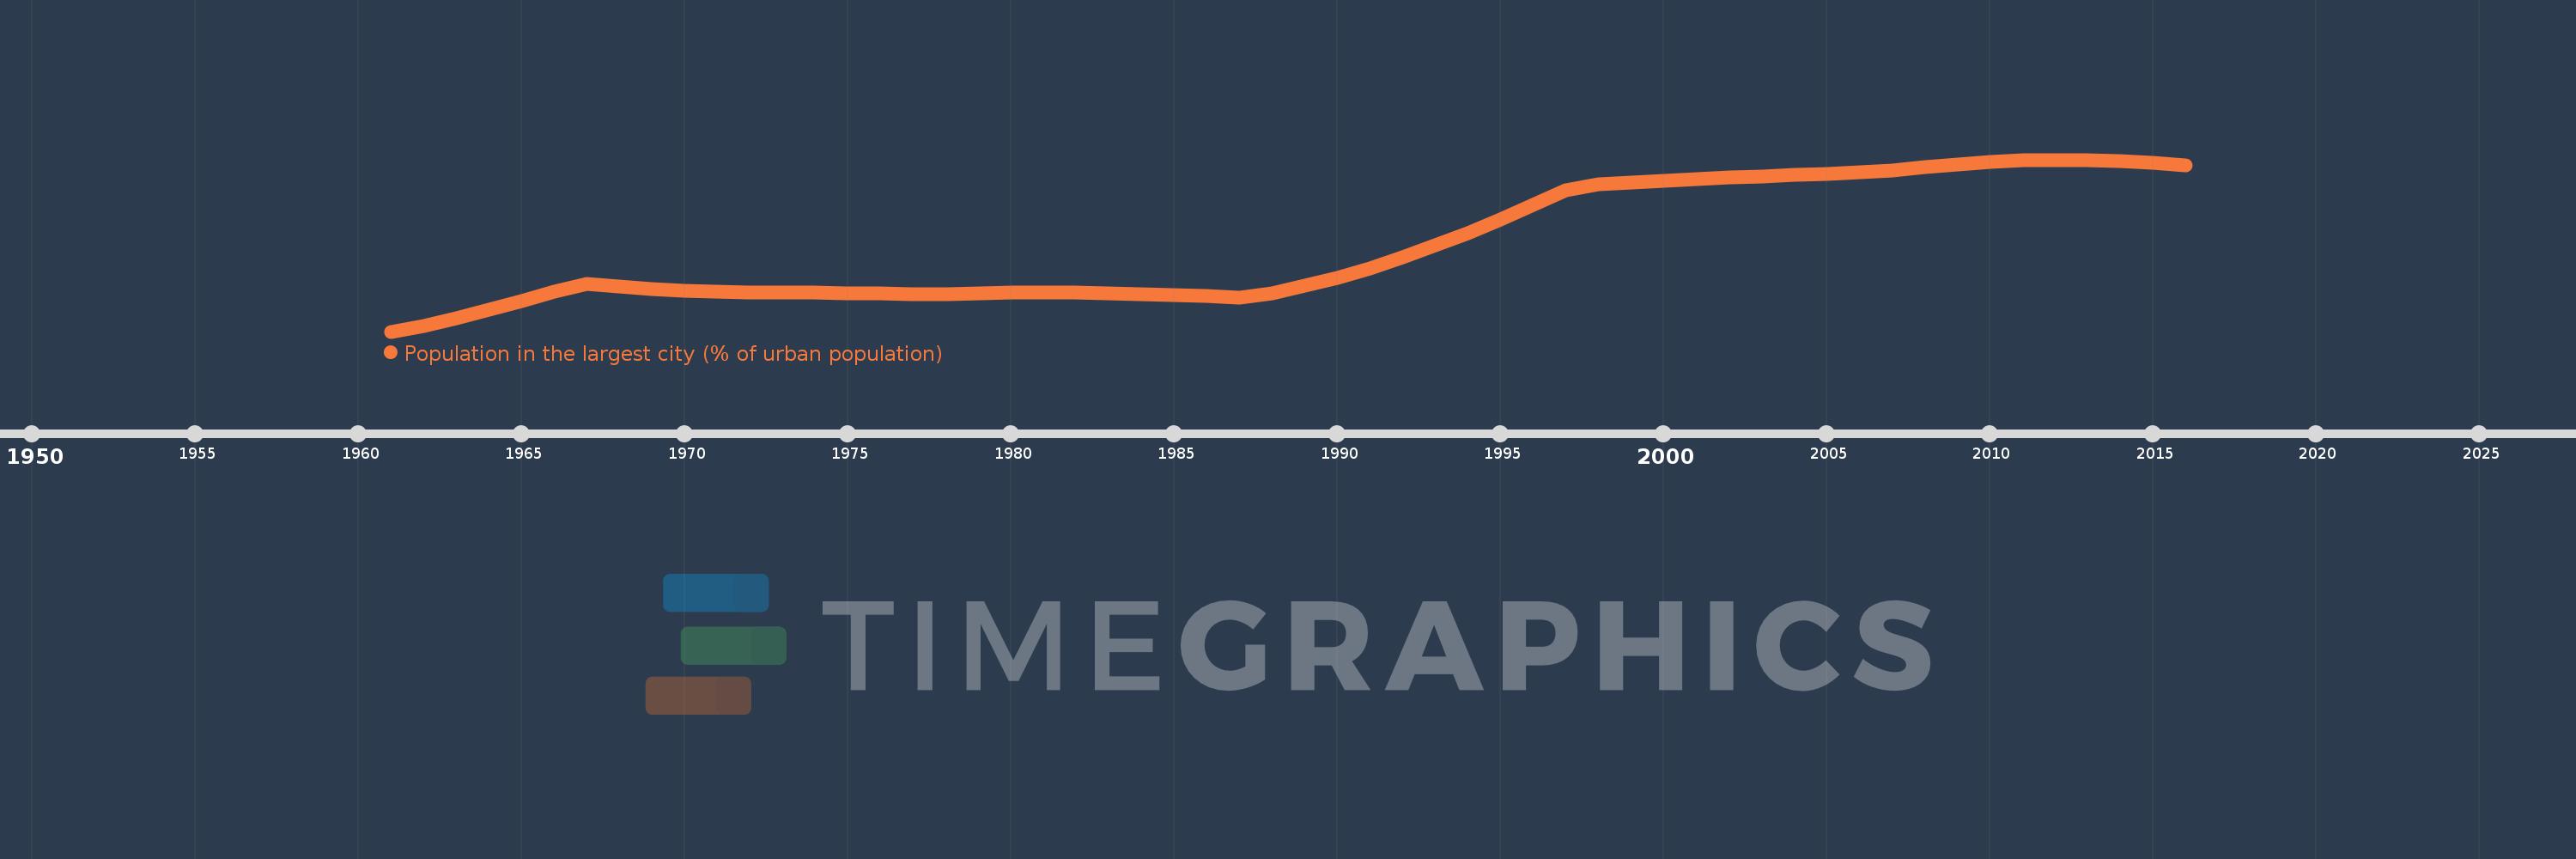
Population in the largest city (% of urban population)
2016,2015,2014,2013,2012,2011,2010,2009,2008,2007,2006,2005,2004,2003,2002,2001,2000,1999,1998,1997,1996,1995,1994,1993,1992,1991,1990,1989,1988,1987,1986,1985,1984,1983,1982,1981,1980,1979,1978,1977,1976,1975,1974,1973,1972,1971,1970,1969,1968,1967,1966,1965,1964,1963,1962,1961
Cette statistique dans les autres pays:
AfghanistanAlbaniaAlgeriaAngolaArab WorldArgentinaArmeniaAustraliaAustriaAzerbaijanBahrainBangladeshBelarusBelgiumBeninBoliviaBosnia and HerzegovinaBrazilBulgariaBurkina FasoBurundiCambodiaCameroonCanadaCentral African RepublicCentral Europe and the BalticsChadChileChinaColombiaCongo, Dem. Rep.Congo, Rep.Costa RicaCote d'IvoireCroatiaCubaCzech RepublicDenmarkDjiboutiDominican RepublicEarly-demographic dividendEast Asia & PacificEast Asia & Pacific (excluding high income)East Asia & Pacific (IDA & IBRD countries)EcuadorEgypt, Arab Rep.El SalvadorEritreaEstoniaEthiopiaEuro areaEurope & Central AsiaEurope & Central Asia (excluding high income)Europe & Central Asia (IDA & IBRD countries)European UnionFinlandFragile and conflict affected situationsFranceGabonGambia, TheGeorgiaGermanyGhanaGreeceGuatemalaGuineaGuinea-BissauHaitiHeavily indebted poor countries (HIPC)High incomeHondurasHong Kong SAR, ChinaHungaryIBRD onlyIDA & IBRD totalIDA blendIDA onlyIDA totalIndiaIndonesiaIran, Islamic Rep.IraqIrelandIsraelItalyJamaicaJapanJordanKazakhstanKenyaKorea, Dem. People’s Rep.Korea, Rep.KuwaitKyrgyz RepublicLao PDRLate-demographic dividendLatin America & Caribbean Latin America & Caribbean (excluding high income)Latin America & the Caribbean (IDA & IBRD countries)LatviaLeast developed countries: UN classificationLebanonLiberiaLibyaLithuaniaLow & middle incomeLow incomeLower middle incomeMacao SAR, ChinaMacedonia, FYRMadagascarMalawiMalaysiaMaliMauritaniaMexicoMiddle East & North AfricaMiddle East & North Africa (excluding high income)Middle East & North Africa (IDA & IBRD countries)Middle incomeMoldovaMongoliaMoroccoMozambiqueMyanmarNamibiaNepalNetherlandsNew ZealandNicaraguaNigerNigeriaNorth AmericaNorwayOECD membersOmanPakistanPanamaPapua New GuineaParaguayPeruPhilippinesPolandPortugalPost-demographic dividendPre-demographic dividendPuerto RicoQatarRomaniaRussian FederationRwandaSaudi ArabiaSenegalSerbiaSierra LeoneSingaporeSlovak RepublicSomaliaSouth AfricaSouth AsiaSouth Asia (IDA & IBRD)South SudanSpainSri LankaSub-Saharan Africa Sub-Saharan Africa (excluding high income)Sub-Saharan Africa (IDA & IBRD countries)SudanSwedenSwitzerlandSyrian Arab RepublicTajikistanTanzaniaThailandTogoTunisiaTurkeyTurkmenistanUgandaUkraineUnited Arab EmiratesUnited KingdomUnited StatesUpper middle incomeUruguayUzbekistanVenezuela, RBVietnamWest Bank and GazaWorldYemen, Rep.ZambiaZimbabwe La ligne de temps
Cette échelle de temps montre un graphique de 1961 année à 2016 année Egypt, Arab Rep.. Les données jusqu'à 1960 année ne sont pas présentés. Quantité d'observations actuelles selon dates: 56.
Source (désignation):
Les indicateurs du développement mondiale
Source (organisation):
United Nations, World Urbanization Prospects.
Catégories:
Urban Development
Dernière mise à jour
23 avr. 2017
Les indicateurs de changement de valeurs selon les années
Minimum:
35.902
1 janv. 1961
Maximum:
47.925
1 janv. 2012
Pour la date d''observation
Valeur
Changement absolu
Le changement par rapport à la valeur précédente
1 janv. 1961
35.902
+35.902
0.0%
1 janv. 1962
36.289
+0.387
1.08%
1 janv. 1963
36.848
+0.559
1.54%
1 janv. 1964
37.429
+0.581
1.58%
1 janv. 1965
38.038
+0.609
1.63%
1 janv. 1966
38.67
+0.632
1.66%
1 janv. 1967
39.255
+0.584
1.51%
1 janv. 1968
39.063
-0.191
-0.49%
1 janv. 1969
38.899
-0.164
-0.42%
1 janv. 1970
38.769
-0.13
-0.33%
1 janv. 1971
38.68
-0.089
-0.23%
1 janv. 1972
38.633
-0.048
-0.12%
1 janv. 1973
38.618
-0.015
-0.04%
1 janv. 1974
38.614
-0.004
-0.01%
1 janv. 1975
38.606
-0.008
-0.02%
1 janv. 1976
38.574
-0.031
-0.08%
1 janv. 1977
38.519
-0.055
-0.14%
1 janv. 1978
38.537
+0.017
0.04%
1 janv. 1979
38.594
+0.057
0.15%
1 janv. 1980
38.626
+0.032
0.08%
1 janv. 1981
38.635
+0.009
0.02%
1 janv. 1982
38.622
-0.013
-0.03%
1 janv. 1983
38.593
-0.029
-0.07%
1 janv. 1984
38.546
-0.048
-0.12%
1 janv. 1985
38.479
-0.067
-0.17%
1 janv. 1986
38.39
-0.089
-0.23%
1 janv. 1987
38.283
-0.107
-0.28%
1 janv. 1988
38.556
+0.273
0.71%
1 janv. 1989
39.091
+0.535
1.39%
1 janv. 1990
39.678
+0.586
1.5%
1 janv. 1991
40.342
+0.665
1.68%
1 janv. 1992
41.092
+0.749
1.86%
1 janv. 1993
41.921
+0.83
2.02%
1 janv. 1994
42.815
+0.894
2.13%
1 janv. 1995
43.763
+0.948
2.21%
1 janv. 1996
44.75
+0.987
2.25%
1 janv. 1997
45.779
+1.029
2.3%
1 janv. 1998
46.24
+0.461
1.01%
1 janv. 1999
46.359
+0.119
0.26%
1 janv. 2000
46.478
+0.119
0.26%
1 janv. 2001
46.591
+0.113
0.24%
1 janv. 2002
46.688
+0.097
0.21%
1 janv. 2003
46.774
+0.086
0.18%
1 janv. 2004
46.856
+0.082
0.18%
1 janv. 2005
46.95
+0.094
0.2%
1 janv. 2006
47.058
+0.109
0.23%
1 janv. 2007
47.192
+0.134
0.28%
1 janv. 2008
47.387
+0.195
0.41%
1 janv. 2009
47.6
+0.213
0.45%
1 janv. 2010
47.771
+0.171
0.36%
1 janv. 2011
47.882
+0.111
0.23%
1 janv. 2012
47.925
+0.044
0.09%
1 janv. 2013
47.895
-0.03
-0.06%
1 janv. 2014
47.822
-0.074
-0.15%
1 janv. 2015
47.741
-0.08
-0.17%
1 janv. 2016
47.557
-0.184
-0.39%
Classement des pays selon les statistiques actuelles par années


Commentaires: