29
/fr/
fr
AIzaSyAYiBZKx7MnpbEhh9jyipgxe19OcubqV5w
April 1, 2024
265075
Togo
TGO
true
2
1
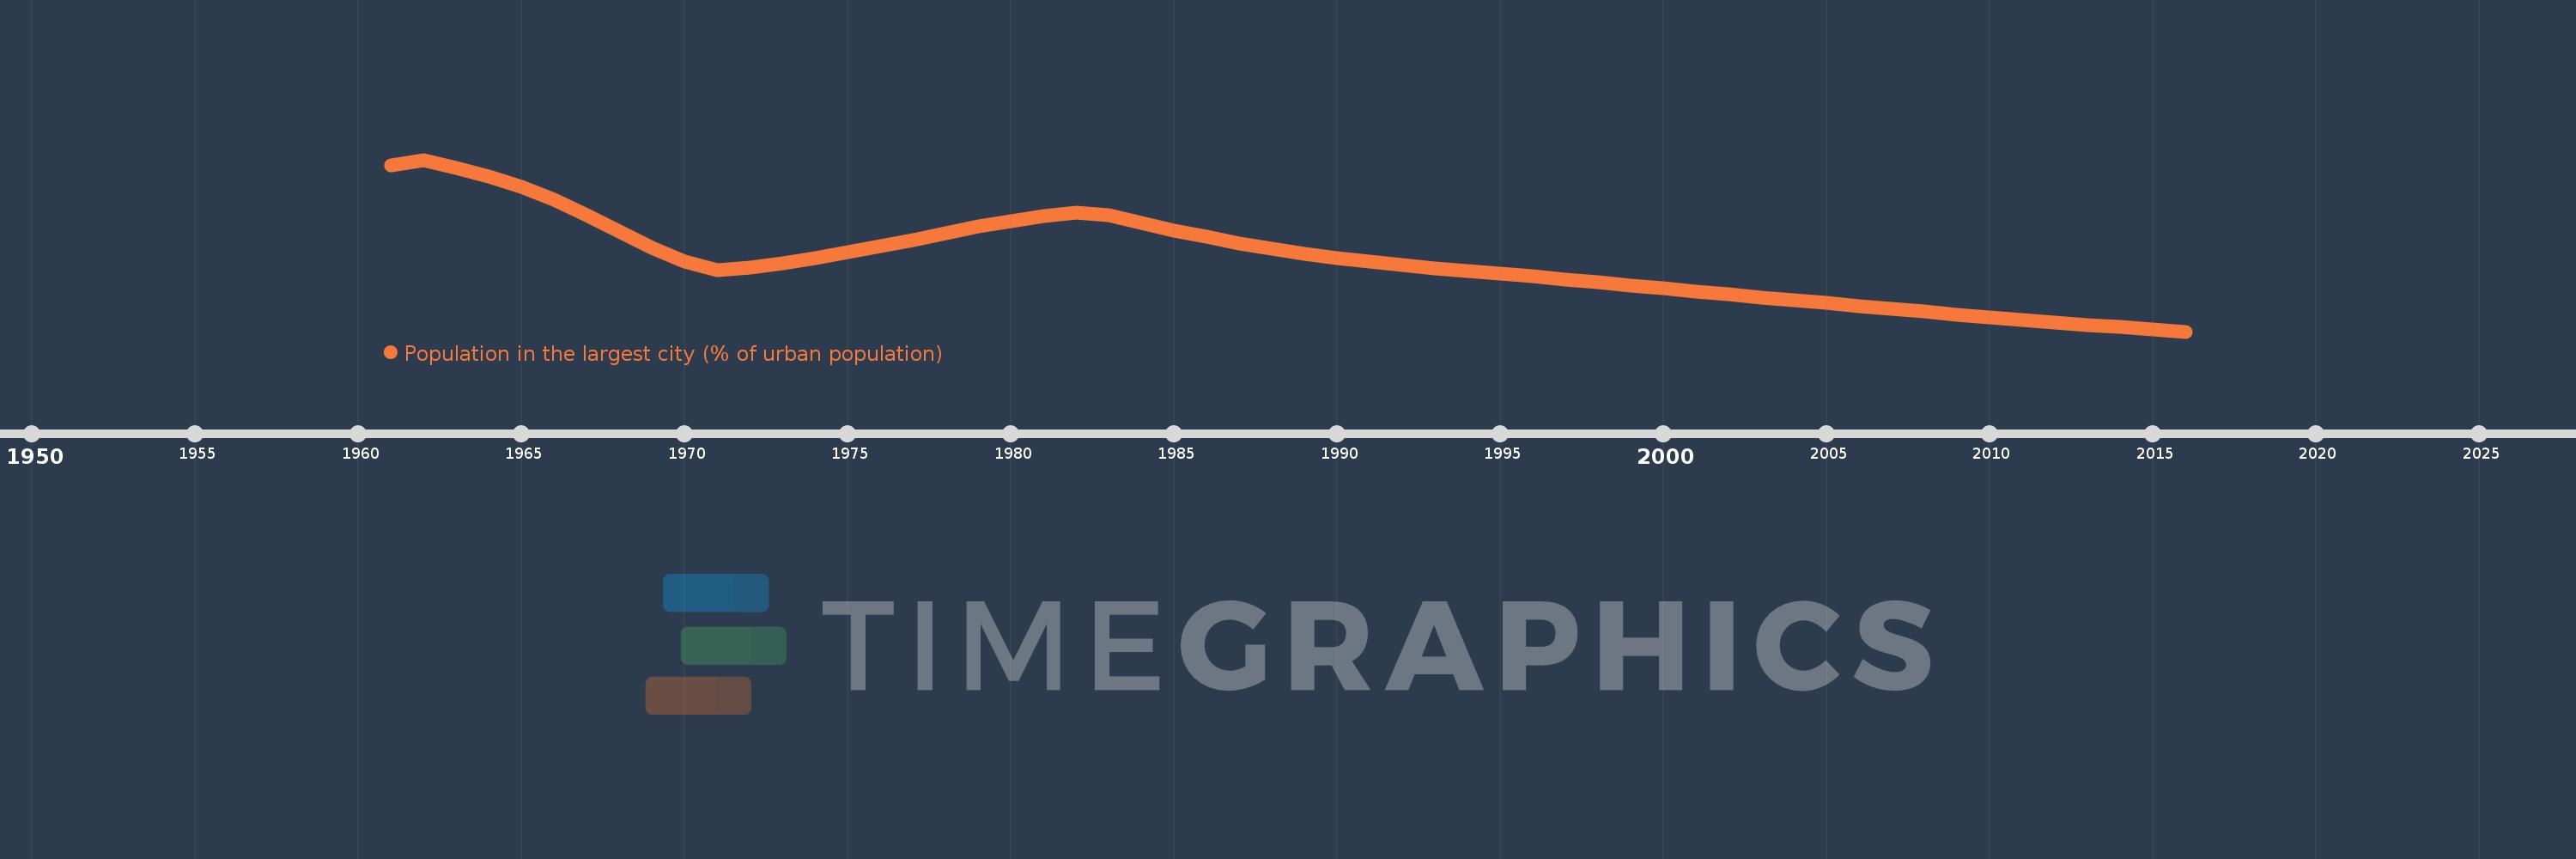
Population in the largest city (% of urban population)
2016,2015,2014,2013,2012,2011,2010,2009,2008,2007,2006,2005,2004,2003,2002,2001,2000,1999,1998,1997,1996,1995,1994,1993,1992,1991,1990,1989,1988,1987,1986,1985,1984,1983,1982,1981,1980,1979,1978,1977,1976,1975,1974,1973,1972,1971,1970,1969,1968,1967,1966,1965,1964,1963,1962,1961
Cette statistique dans les autres pays:
AfghanistanAlbaniaAlgeriaAngolaArab WorldArgentinaArmeniaAustraliaAustriaAzerbaijanBahrainBangladeshBelarusBelgiumBeninBoliviaBosnia and HerzegovinaBrazilBulgariaBurkina FasoBurundiCambodiaCameroonCanadaCentral African RepublicCentral Europe and the BalticsChadChileChinaColombiaCongo, Dem. Rep.Congo, Rep.Costa RicaCote d'IvoireCroatiaCubaCzech RepublicDenmarkDjiboutiDominican RepublicEarly-demographic dividendEast Asia & PacificEast Asia & Pacific (excluding high income)East Asia & Pacific (IDA & IBRD countries)EcuadorEgypt, Arab Rep.El SalvadorEritreaEstoniaEthiopiaEuro areaEurope & Central AsiaEurope & Central Asia (excluding high income)Europe & Central Asia (IDA & IBRD countries)European UnionFinlandFragile and conflict affected situationsFranceGabonGambia, TheGeorgiaGermanyGhanaGreeceGuatemalaGuineaGuinea-BissauHaitiHeavily indebted poor countries (HIPC)High incomeHondurasHong Kong SAR, ChinaHungaryIBRD onlyIDA & IBRD totalIDA blendIDA onlyIDA totalIndiaIndonesiaIran, Islamic Rep.IraqIrelandIsraelItalyJamaicaJapanJordanKazakhstanKenyaKorea, Dem. People’s Rep.Korea, Rep.KuwaitKyrgyz RepublicLao PDRLate-demographic dividendLatin America & Caribbean Latin America & Caribbean (excluding high income)Latin America & the Caribbean (IDA & IBRD countries)LatviaLeast developed countries: UN classificationLebanonLiberiaLibyaLithuaniaLow & middle incomeLow incomeLower middle incomeMacao SAR, ChinaMacedonia, FYRMadagascarMalawiMalaysiaMaliMauritaniaMexicoMiddle East & North AfricaMiddle East & North Africa (excluding high income)Middle East & North Africa (IDA & IBRD countries)Middle incomeMoldovaMongoliaMoroccoMozambiqueMyanmarNamibiaNepalNetherlandsNew ZealandNicaraguaNigerNigeriaNorth AmericaNorwayOECD membersOmanPakistanPanamaPapua New GuineaParaguayPeruPhilippinesPolandPortugalPost-demographic dividendPre-demographic dividendPuerto RicoQatarRomaniaRussian FederationRwandaSaudi ArabiaSenegalSerbiaSierra LeoneSingaporeSlovak RepublicSomaliaSouth AfricaSouth AsiaSouth Asia (IDA & IBRD)South SudanSpainSri LankaSub-Saharan Africa Sub-Saharan Africa (excluding high income)Sub-Saharan Africa (IDA & IBRD countries)SudanSwedenSwitzerlandSyrian Arab RepublicTajikistanTanzaniaThailandTogoTunisiaTurkeyTurkmenistanUgandaUkraineUnited Arab EmiratesUnited KingdomUnited StatesUpper middle incomeUruguayUzbekistanVenezuela, RBVietnamWest Bank and GazaWorldYemen, Rep.ZambiaZimbabwe La ligne de temps
Cette échelle de temps montre un graphique de 1961 année à 2016 année Togo. Les données jusqu'à 1960 année ne sont pas présentés. Quantité d'observations actuelles selon dates: 56.
Source (désignation):
Les indicateurs du développement mondiale
Source (organisation):
United Nations, World Urbanization Prospects.
Catégories:
Urban Development
Dernière mise à jour
23 avr. 2017
Les indicateurs de changement de valeurs selon les années
Minimum:
32.76
1 janv. 2016
Maximum:
60.308
1 janv. 1962
Pour la date d''observation
Valeur
Changement absolu
Le changement par rapport à la valeur précédente
1 janv. 1961
59.464
+59.464
0.0%
1 janv. 1962
60.308
+0.844
1.42%
1 janv. 1963
58.983
-1.325
-2.2%
1 janv. 1964
57.611
-1.372
-2.33%
1 janv. 1965
55.94
-1.67
-2.9%
1 janv. 1966
53.871
-2.069
-3.7%
1 janv. 1967
51.42
-2.451
-4.55%
1 janv. 1968
48.775
-2.645
-5.14%
1 janv. 1969
46.195
-2.579
-5.29%
1 janv. 1970
43.928
-2.267
-4.91%
1 janv. 1971
42.572
-1.357
-3.09%
1 janv. 1972
43.036
+0.464
1.09%
1 janv. 1973
43.712
+0.677
1.57%
1 janv. 1974
44.551
+0.838
1.92%
1 janv. 1975
45.485
+0.935
2.1%
1 janv. 1976
46.457
+0.971
2.14%
1 janv. 1977
47.473
+1.016
2.19%
1 janv. 1978
48.531
+1.058
2.23%
1 janv. 1979
49.569
+1.038
2.14%
1 janv. 1980
50.496
+0.928
1.87%
1 janv. 1981
51.258
+0.762
1.51%
1 janv. 1982
51.828
+0.569
1.11%
1 janv. 1983
51.441
-0.387
-0.75%
1 janv. 1984
50.187
-1.254
-2.44%
1 janv. 1985
48.992
-1.195
-2.38%
1 janv. 1986
47.912
-1.08
-2.2%
1 janv. 1987
46.946
-0.966
-2.02%
1 janv. 1988
46.071
-0.875
-1.86%
1 janv. 1989
45.287
-0.784
-1.7%
1 janv. 1990
44.586
-0.701
-1.55%
1 janv. 1991
43.961
-0.626
-1.4%
1 janv. 1992
43.41
-0.55
-1.25%
1 janv. 1993
42.926
-0.484
-1.12%
1 janv. 1994
42.478
-0.448
-1.04%
1 janv. 1995
42.041
-0.437
-1.03%
1 janv. 1996
41.594
-0.447
-1.06%
1 janv. 1997
41.132
-0.461
-1.11%
1 janv. 1998
40.658
-0.474
-1.15%
1 janv. 1999
40.178
-0.48
-1.18%
1 janv. 2000
39.695
-0.483
-1.2%
1 janv. 2001
39.215
-0.48
-1.21%
1 janv. 2002
38.735
-0.48
-1.22%
1 janv. 2003
38.256
-0.479
-1.24%
1 janv. 2004
37.78
-0.476
-1.24%
1 janv. 2005
37.311
-0.47
-1.24%
1 janv. 2006
36.846
-0.465
-1.25%
1 janv. 2007
36.391
-0.455
-1.24%
1 janv. 2008
35.944
-0.447
-1.23%
1 janv. 2009
35.506
-0.437
-1.22%
1 janv. 2010
35.078
-0.428
-1.21%
1 janv. 2011
34.661
-0.418
-1.19%
1 janv. 2012
34.254
-0.407
-1.17%
1 janv. 2013
33.856
-0.398
-1.16%
1 janv. 2014
33.471
-0.385
-1.14%
1 janv. 2015
33.099
-0.371
-1.11%
1 janv. 2016
32.76
-0.339
-1.02%
Classement des pays selon les statistiques actuelles par années


Commentaires: