29
/fr/
fr
AIzaSyAYiBZKx7MnpbEhh9jyipgxe19OcubqV5w
April 1, 2024
156509
Indonesia
IDN
true
2
1
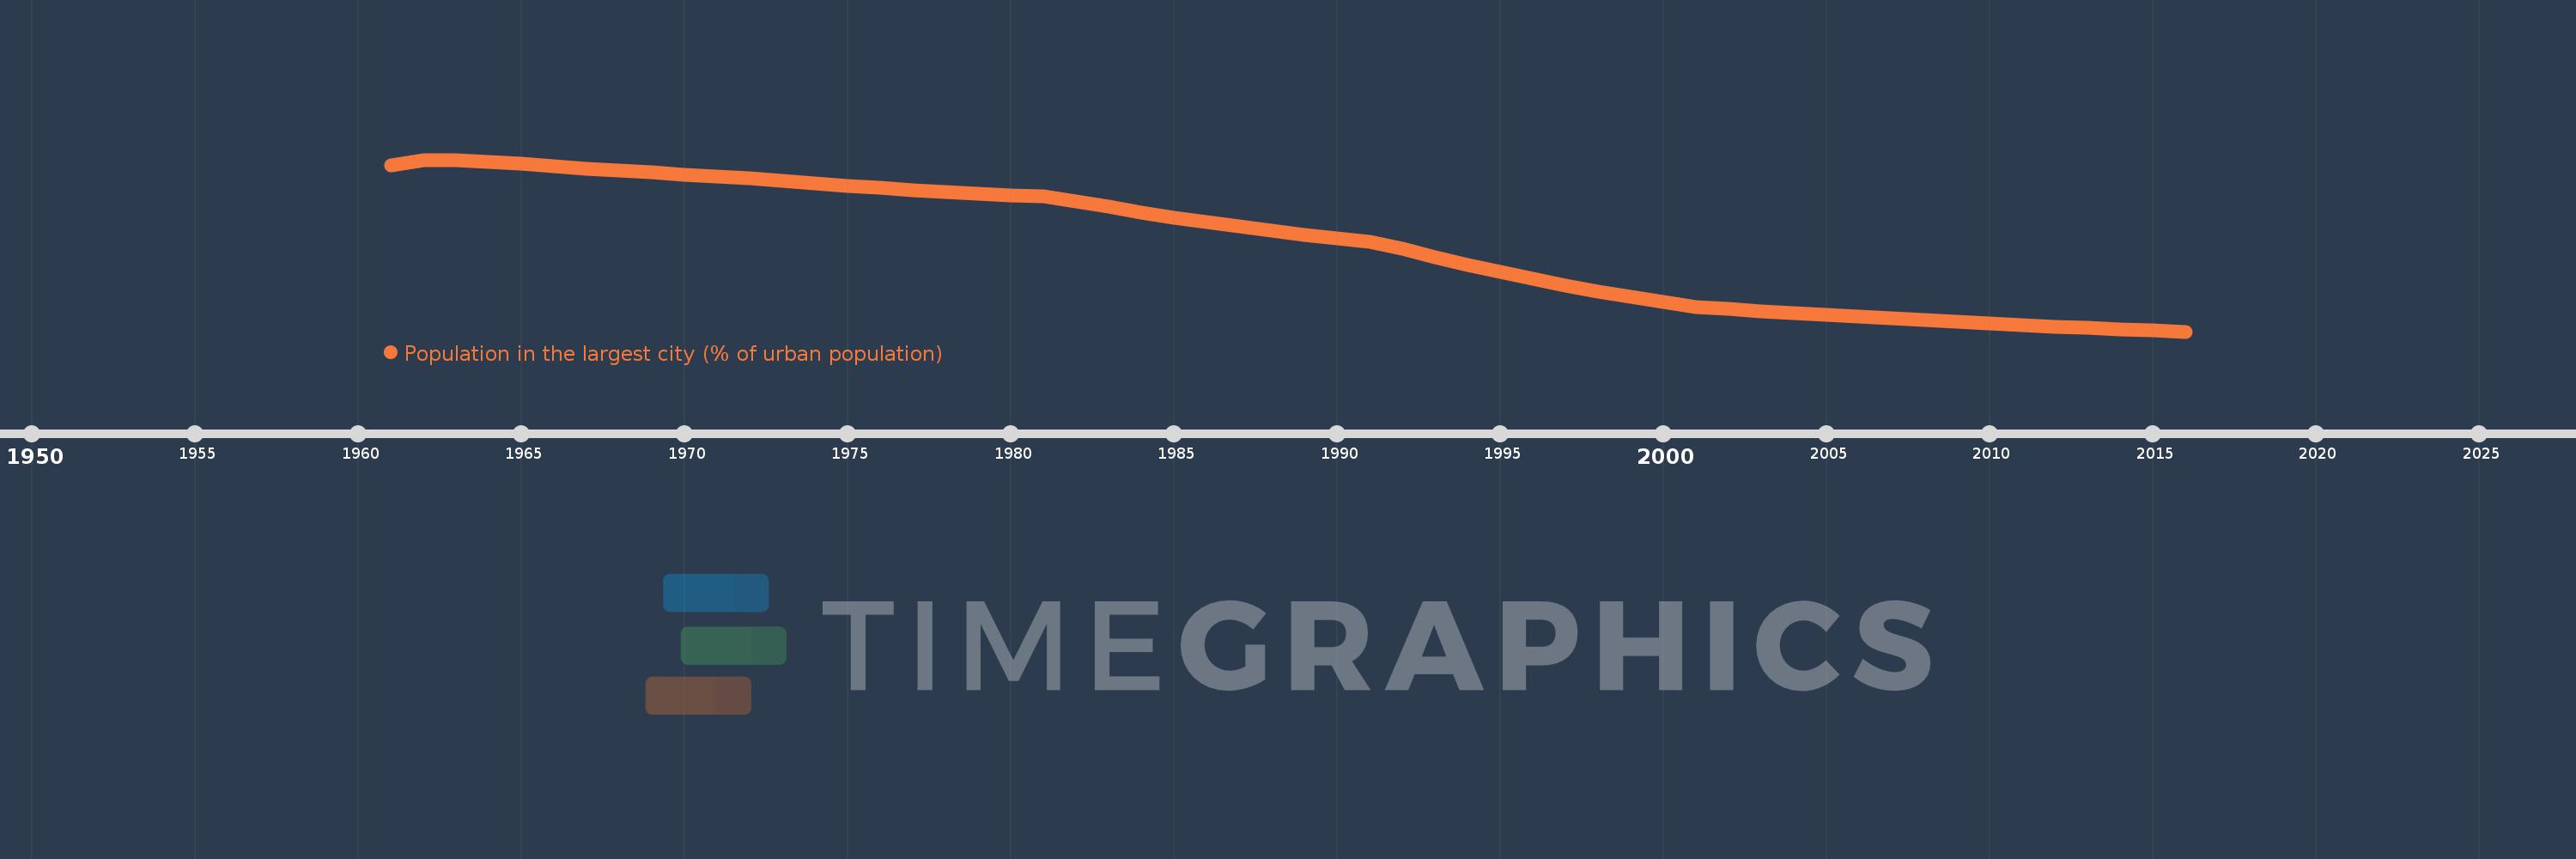
Population in the largest city (% of urban population)
2016,2015,2014,2013,2012,2011,2010,2009,2008,2007,2006,2005,2004,2003,2002,2001,2000,1999,1998,1997,1996,1995,1994,1993,1992,1991,1990,1989,1988,1987,1986,1985,1984,1983,1982,1981,1980,1979,1978,1977,1976,1975,1974,1973,1972,1971,1970,1969,1968,1967,1966,1965,1964,1963,1962,1961
Cette statistique dans les autres pays:
AfghanistanAlbaniaAlgeriaAngolaArab WorldArgentinaArmeniaAustraliaAustriaAzerbaijanBahrainBangladeshBelarusBelgiumBeninBoliviaBosnia and HerzegovinaBrazilBulgariaBurkina FasoBurundiCambodiaCameroonCanadaCentral African RepublicCentral Europe and the BalticsChadChileChinaColombiaCongo, Dem. Rep.Congo, Rep.Costa RicaCote d'IvoireCroatiaCubaCzech RepublicDenmarkDjiboutiDominican RepublicEarly-demographic dividendEast Asia & PacificEast Asia & Pacific (excluding high income)East Asia & Pacific (IDA & IBRD countries)EcuadorEgypt, Arab Rep.El SalvadorEritreaEstoniaEthiopiaEuro areaEurope & Central AsiaEurope & Central Asia (excluding high income)Europe & Central Asia (IDA & IBRD countries)European UnionFinlandFragile and conflict affected situationsFranceGabonGambia, TheGeorgiaGermanyGhanaGreeceGuatemalaGuineaGuinea-BissauHaitiHeavily indebted poor countries (HIPC)High incomeHondurasHong Kong SAR, ChinaHungaryIBRD onlyIDA & IBRD totalIDA blendIDA onlyIDA totalIndiaIndonesiaIran, Islamic Rep.IraqIrelandIsraelItalyJamaicaJapanJordanKazakhstanKenyaKorea, Dem. People’s Rep.Korea, Rep.KuwaitKyrgyz RepublicLao PDRLate-demographic dividendLatin America & Caribbean Latin America & Caribbean (excluding high income)Latin America & the Caribbean (IDA & IBRD countries)LatviaLeast developed countries: UN classificationLebanonLiberiaLibyaLithuaniaLow & middle incomeLow incomeLower middle incomeMacao SAR, ChinaMacedonia, FYRMadagascarMalawiMalaysiaMaliMauritaniaMexicoMiddle East & North AfricaMiddle East & North Africa (excluding high income)Middle East & North Africa (IDA & IBRD countries)Middle incomeMoldovaMongoliaMoroccoMozambiqueMyanmarNamibiaNepalNetherlandsNew ZealandNicaraguaNigerNigeriaNorth AmericaNorwayOECD membersOmanPakistanPanamaPapua New GuineaParaguayPeruPhilippinesPolandPortugalPost-demographic dividendPre-demographic dividendPuerto RicoQatarRomaniaRussian FederationRwandaSaudi ArabiaSenegalSerbiaSierra LeoneSingaporeSlovak RepublicSomaliaSouth AfricaSouth AsiaSouth Asia (IDA & IBRD)South SudanSpainSri LankaSub-Saharan Africa Sub-Saharan Africa (excluding high income)Sub-Saharan Africa (IDA & IBRD countries)SudanSwedenSwitzerlandSyrian Arab RepublicTajikistanTanzaniaThailandTogoTunisiaTurkeyTurkmenistanUgandaUkraineUnited Arab EmiratesUnited KingdomUnited StatesUpper middle incomeUruguayUzbekistanVenezuela, RBVietnamWest Bank and GazaWorldYemen, Rep.ZambiaZimbabwe La ligne de temps
Cette échelle de temps montre un graphique de 1961 année à 2016 année Indonesia. Les données jusqu'à 1960 année ne sont pas présentés. Quantité d'observations actuelles selon dates: 56.
Source (désignation):
Les indicateurs du développement mondiale
Source (organisation):
United Nations, World Urbanization Prospects.
Catégories:
Urban Development
Dernière mise à jour
23 avr. 2017
Les indicateurs de changement de valeurs selon les années
Minimum:
7.458
1 janv. 2016
Maximum:
21.337
1 janv. 1963
Pour la date d''observation
Valeur
Changement absolu
Le changement par rapport à la valeur précédente
1 janv. 1961
20.919
+20.919
0.0%
1 janv. 1962
21.316
+0.397
1.9%
1 janv. 1963
21.337
+0.021
0.1%
1 janv. 1964
21.165
-0.173
-0.81%
1 janv. 1965
20.992
-0.173
-0.82%
1 janv. 1966
20.817
-0.175
-0.83%
1 janv. 1967
20.642
-0.175
-0.84%
1 janv. 1968
20.467
-0.175
-0.85%
1 janv. 1969
20.298
-0.169
-0.83%
1 janv. 1970
20.131
-0.167
-0.82%
1 janv. 1971
19.973
-0.158
-0.78%
1 janv. 1972
19.821
-0.153
-0.76%
1 janv. 1973
19.625
-0.195
-0.99%
1 janv. 1974
19.425
-0.2
-1.02%
1 janv. 1975
19.237
-0.188
-0.97%
1 janv. 1976
19.06
-0.176
-0.92%
1 janv. 1977
18.897
-0.163
-0.86%
1 janv. 1978
18.747
-0.151
-0.8%
1 janv. 1979
18.606
-0.14
-0.75%
1 janv. 1980
18.477
-0.13
-0.7%
1 janv. 1981
18.356
-0.121
-0.65%
1 janv. 1982
17.992
-0.364
-1.98%
1 janv. 1983
17.523
-0.469
-2.61%
1 janv. 1984
17.081
-0.442
-2.52%
1 janv. 1985
16.667
-0.414
-2.42%
1 janv. 1986
16.282
-0.385
-2.31%
1 janv. 1987
15.925
-0.356
-2.19%
1 janv. 1988
15.595
-0.331
-2.08%
1 janv. 1989
15.287
-0.307
-1.97%
1 janv. 1990
15.001
-0.286
-1.87%
1 janv. 1991
14.733
-0.268
-1.79%
1 janv. 1992
14.167
-0.566
-3.84%
1 janv. 1993
13.487
-0.68
-4.8%
1 janv. 1994
12.854
-0.633
-4.69%
1 janv. 1995
12.264
-0.591
-4.6%
1 janv. 1996
11.712
-0.552
-4.5%
1 janv. 1997
11.197
-0.515
-4.4%
1 janv. 1998
10.716
-0.481
-4.29%
1 janv. 1999
10.265
-0.451
-4.21%
1 janv. 2000
9.841
-0.424
-4.13%
1 janv. 2001
9.442
-0.399
-4.05%
1 janv. 2002
9.271
-0.171
-1.81%
1 janv. 2003
9.107
-0.164
-1.77%
1 janv. 2004
8.949
-0.158
-1.74%
1 janv. 2005
8.796
-0.153
-1.71%
1 janv. 2006
8.648
-0.147
-1.68%
1 janv. 2007
8.506
-0.142
-1.64%
1 janv. 2008
8.369
-0.137
-1.61%
1 janv. 2009
8.236
-0.133
-1.58%
1 janv. 2010
8.108
-0.128
-1.56%
1 janv. 2011
7.984
-0.125
-1.54%
1 janv. 2012
7.865
-0.119
-1.49%
1 janv. 2013
7.751
-0.113
-1.44%
1 janv. 2014
7.644
-0.107
-1.38%
1 janv. 2015
7.545
-0.099
-1.3%
1 janv. 2016
7.458
-0.087
-1.16%
Classement des pays selon les statistiques actuelles par années


Commentaires: