29
/fr/
fr
AIzaSyAYiBZKx7MnpbEhh9jyipgxe19OcubqV5w
April 1, 2024
278137
Uruguay
URY
true
2
1
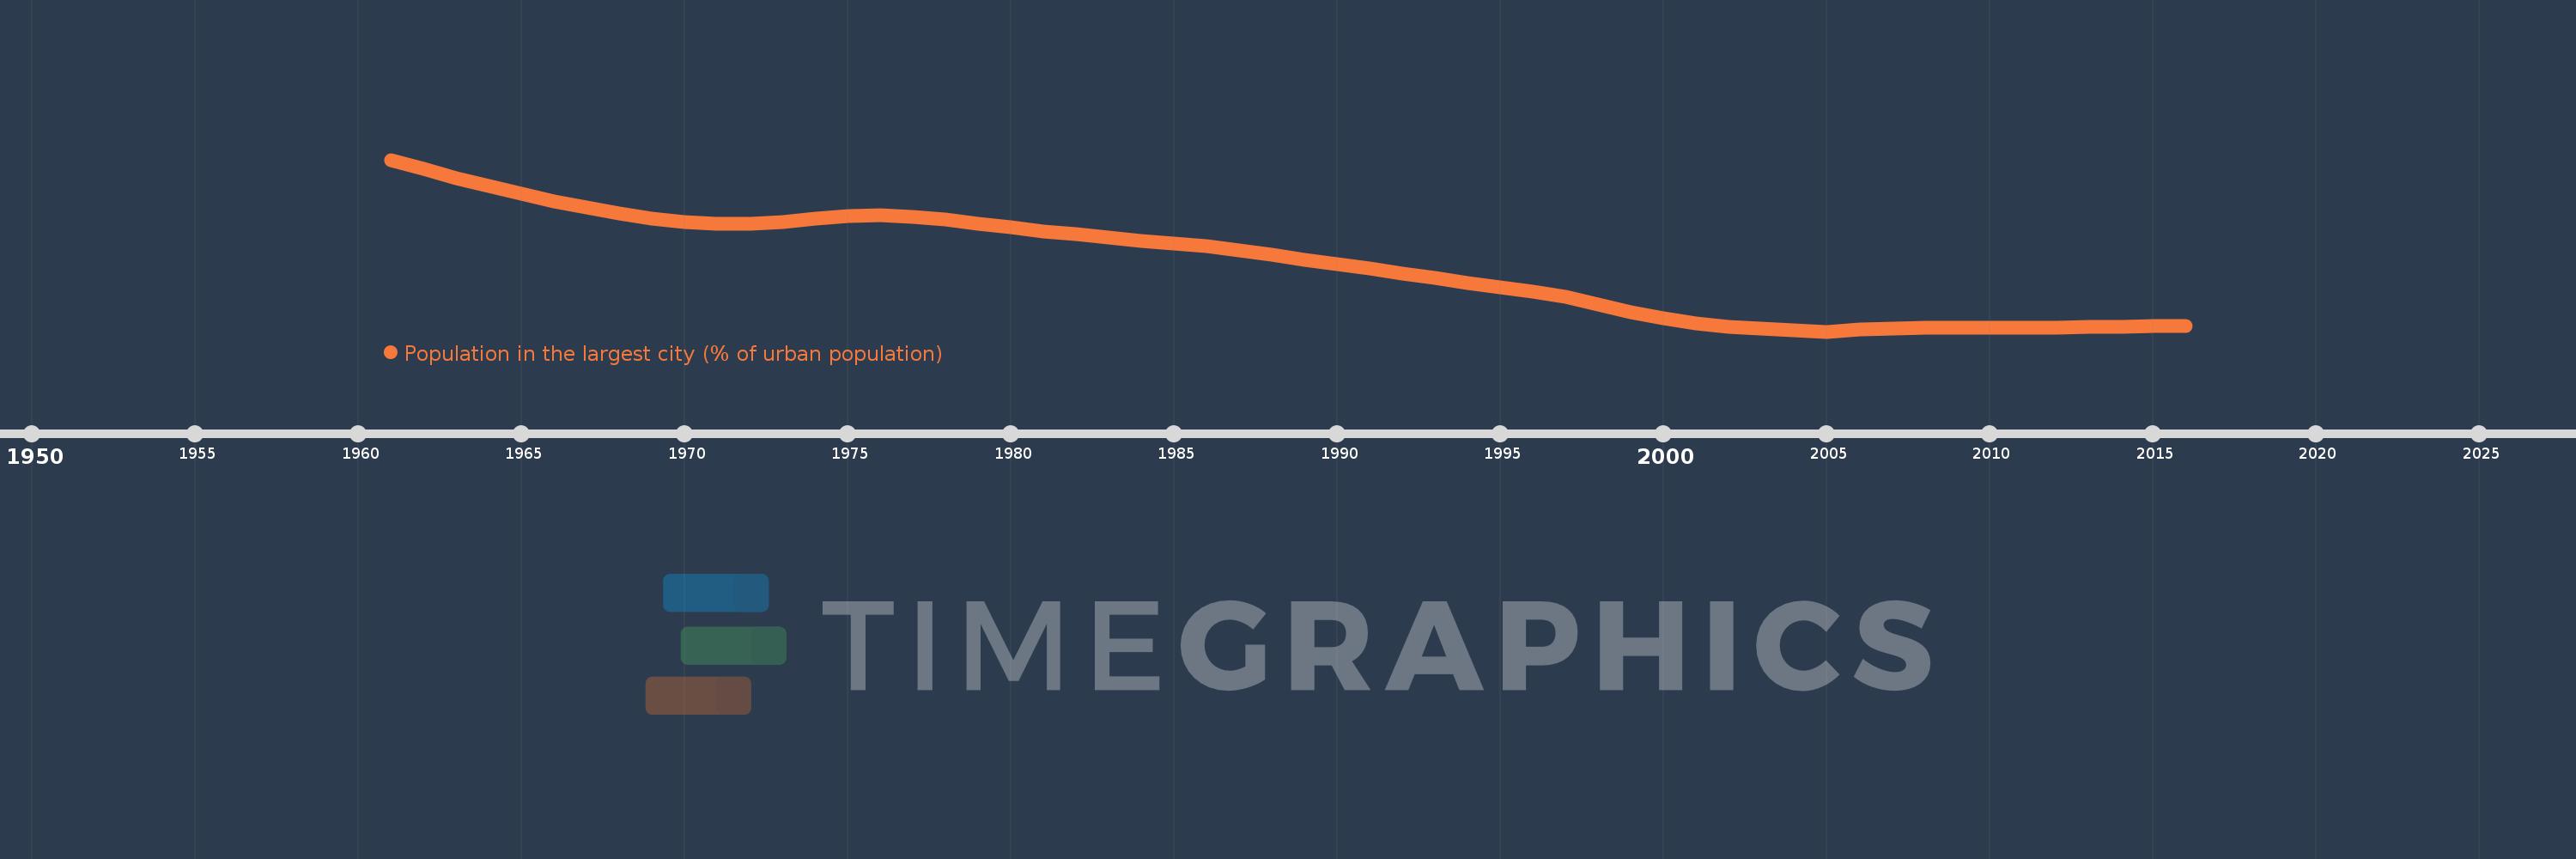
Population in the largest city (% of urban population)
2016,2015,2014,2013,2012,2011,2010,2009,2008,2007,2006,2005,2004,2003,2002,2001,2000,1999,1998,1997,1996,1995,1994,1993,1992,1991,1990,1989,1988,1987,1986,1985,1984,1983,1982,1981,1980,1979,1978,1977,1976,1975,1974,1973,1972,1971,1970,1969,1968,1967,1966,1965,1964,1963,1962,1961
Cette statistique dans les autres pays:
AfghanistanAlbaniaAlgeriaAngolaArab WorldArgentinaArmeniaAustraliaAustriaAzerbaijanBahrainBangladeshBelarusBelgiumBeninBoliviaBosnia and HerzegovinaBrazilBulgariaBurkina FasoBurundiCambodiaCameroonCanadaCentral African RepublicCentral Europe and the BalticsChadChileChinaColombiaCongo, Dem. Rep.Congo, Rep.Costa RicaCote d'IvoireCroatiaCubaCzech RepublicDenmarkDjiboutiDominican RepublicEarly-demographic dividendEast Asia & PacificEast Asia & Pacific (excluding high income)East Asia & Pacific (IDA & IBRD countries)EcuadorEgypt, Arab Rep.El SalvadorEritreaEstoniaEthiopiaEuro areaEurope & Central AsiaEurope & Central Asia (excluding high income)Europe & Central Asia (IDA & IBRD countries)European UnionFinlandFragile and conflict affected situationsFranceGabonGambia, TheGeorgiaGermanyGhanaGreeceGuatemalaGuineaGuinea-BissauHaitiHeavily indebted poor countries (HIPC)High incomeHondurasHong Kong SAR, ChinaHungaryIBRD onlyIDA & IBRD totalIDA blendIDA onlyIDA totalIndiaIndonesiaIran, Islamic Rep.IraqIrelandIsraelItalyJamaicaJapanJordanKazakhstanKenyaKorea, Dem. People’s Rep.Korea, Rep.KuwaitKyrgyz RepublicLao PDRLate-demographic dividendLatin America & Caribbean Latin America & Caribbean (excluding high income)Latin America & the Caribbean (IDA & IBRD countries)LatviaLeast developed countries: UN classificationLebanonLiberiaLibyaLithuaniaLow & middle incomeLow incomeLower middle incomeMacao SAR, ChinaMacedonia, FYRMadagascarMalawiMalaysiaMaliMauritaniaMexicoMiddle East & North AfricaMiddle East & North Africa (excluding high income)Middle East & North Africa (IDA & IBRD countries)Middle incomeMoldovaMongoliaMoroccoMozambiqueMyanmarNamibiaNepalNetherlandsNew ZealandNicaraguaNigerNigeriaNorth AmericaNorwayOECD membersOmanPakistanPanamaPapua New GuineaParaguayPeruPhilippinesPolandPortugalPost-demographic dividendPre-demographic dividendPuerto RicoQatarRomaniaRussian FederationRwandaSaudi ArabiaSenegalSerbiaSierra LeoneSingaporeSlovak RepublicSomaliaSouth AfricaSouth AsiaSouth Asia (IDA & IBRD)South SudanSpainSri LankaSub-Saharan Africa Sub-Saharan Africa (excluding high income)Sub-Saharan Africa (IDA & IBRD countries)SudanSwedenSwitzerlandSyrian Arab RepublicTajikistanTanzaniaThailandTogoTunisiaTurkeyTurkmenistanUgandaUkraineUnited Arab EmiratesUnited KingdomUnited StatesUpper middle incomeUruguayUzbekistanVenezuela, RBVietnamWest Bank and GazaWorldYemen, Rep.ZambiaZimbabwe La ligne de temps
Cette échelle de temps montre un graphique de 1961 année à 2016 année Uruguay. Les données jusqu'à 1960 année ne sont pas présentés. Quantité d'observations actuelles selon dates: 56.
Source (désignation):
Les indicateurs du développement mondiale
Source (organisation):
United Nations, World Urbanization Prospects.
Catégories:
Urban Development
Dernière mise à jour
23 avr. 2017
Les indicateurs de changement de valeurs selon les années
Minimum:
51.829
1 janv. 2005
Maximum:
63.08
1 janv. 1961
Pour la date d''observation
Valeur
Changement absolu
Le changement par rapport à la valeur précédente
1 janv. 1961
63.08
+63.08
0.0%
1 janv. 1962
62.462
-0.618
-0.98%
1 janv. 1963
61.883
-0.579
-0.93%
1 janv. 1964
61.342
-0.541
-0.87%
1 janv. 1965
60.84
-0.502
-0.82%
1 janv. 1966
60.375
-0.465
-0.76%
1 janv. 1967
59.941
-0.434
-0.72%
1 janv. 1968
59.542
-0.399
-0.67%
1 janv. 1969
59.208
-0.334
-0.56%
1 janv. 1970
58.974
-0.234
-0.39%
1 janv. 1971
58.862
-0.112
-0.19%
1 janv. 1972
58.885
+0.023
0.04%
1 janv. 1973
59.021
+0.135
0.23%
1 janv. 1974
59.21
+0.19
0.32%
1 janv. 1975
59.374
+0.164
0.28%
1 janv. 1976
59.446
+0.071
0.12%
1 janv. 1977
59.34
-0.106
-0.18%
1 janv. 1978
59.151
-0.189
-0.32%
1 janv. 1979
58.907
-0.244
-0.41%
1 janv. 1980
58.649
-0.258
-0.44%
1 janv. 1981
58.408
-0.241
-0.41%
1 janv. 1982
58.187
-0.221
-0.38%
1 janv. 1983
57.976
-0.211
-0.36%
1 janv. 1984
57.777
-0.2
-0.34%
1 janv. 1985
57.587
-0.19
-0.33%
1 janv. 1986
57.404
-0.183
-0.32%
1 janv. 1987
57.138
-0.266
-0.46%
1 janv. 1988
56.842
-0.295
-0.52%
1 janv. 1989
56.554
-0.288
-0.51%
1 janv. 1990
56.263
-0.291
-0.51%
1 janv. 1991
55.963
-0.301
-0.53%
1 janv. 1992
55.653
-0.309
-0.55%
1 janv. 1993
55.342
-0.312
-0.56%
1 janv. 1994
55.032
-0.31
-0.56%
1 janv. 1995
54.73
-0.302
-0.55%
1 janv. 1996
54.443
-0.287
-0.53%
1 janv. 1997
54.135
-0.308
-0.56%
1 janv. 1998
53.598
-0.537
-0.99%
1 janv. 1999
53.104
-0.494
-0.92%
1 janv. 2000
52.686
-0.418
-0.79%
1 janv. 2001
52.361
-0.325
-0.62%
1 janv. 2002
52.139
-0.222
-0.42%
1 janv. 2003
52.005
-0.134
-0.26%
1 janv. 2004
51.919
-0.086
-0.17%
1 janv. 2005
51.829
-0.089
-0.17%
1 janv. 2006
51.966
+0.137
0.26%
1 janv. 2007
52.048
+0.081
0.16%
1 janv. 2008
52.083
+0.035
0.07%
1 janv. 2009
52.087
+0.003
0.01%
1 janv. 2010
52.082
-0.005
-0.01%
1 janv. 2011
52.085
+0.004
0.01%
1 janv. 2012
52.101
+0.015
0.03%
1 janv. 2013
52.122
+0.021
0.04%
1 janv. 2014
52.149
+0.027
0.05%
1 janv. 2015
52.178
+0.029
0.06%
1 janv. 2016
52.186
+0.008
0.02%
Classement des pays selon les statistiques actuelles par années


Commentaires: