29
/fr/
fr
AIzaSyAYiBZKx7MnpbEhh9jyipgxe19OcubqV5w
April 1, 2024
277022
United States
USA
true
2
1
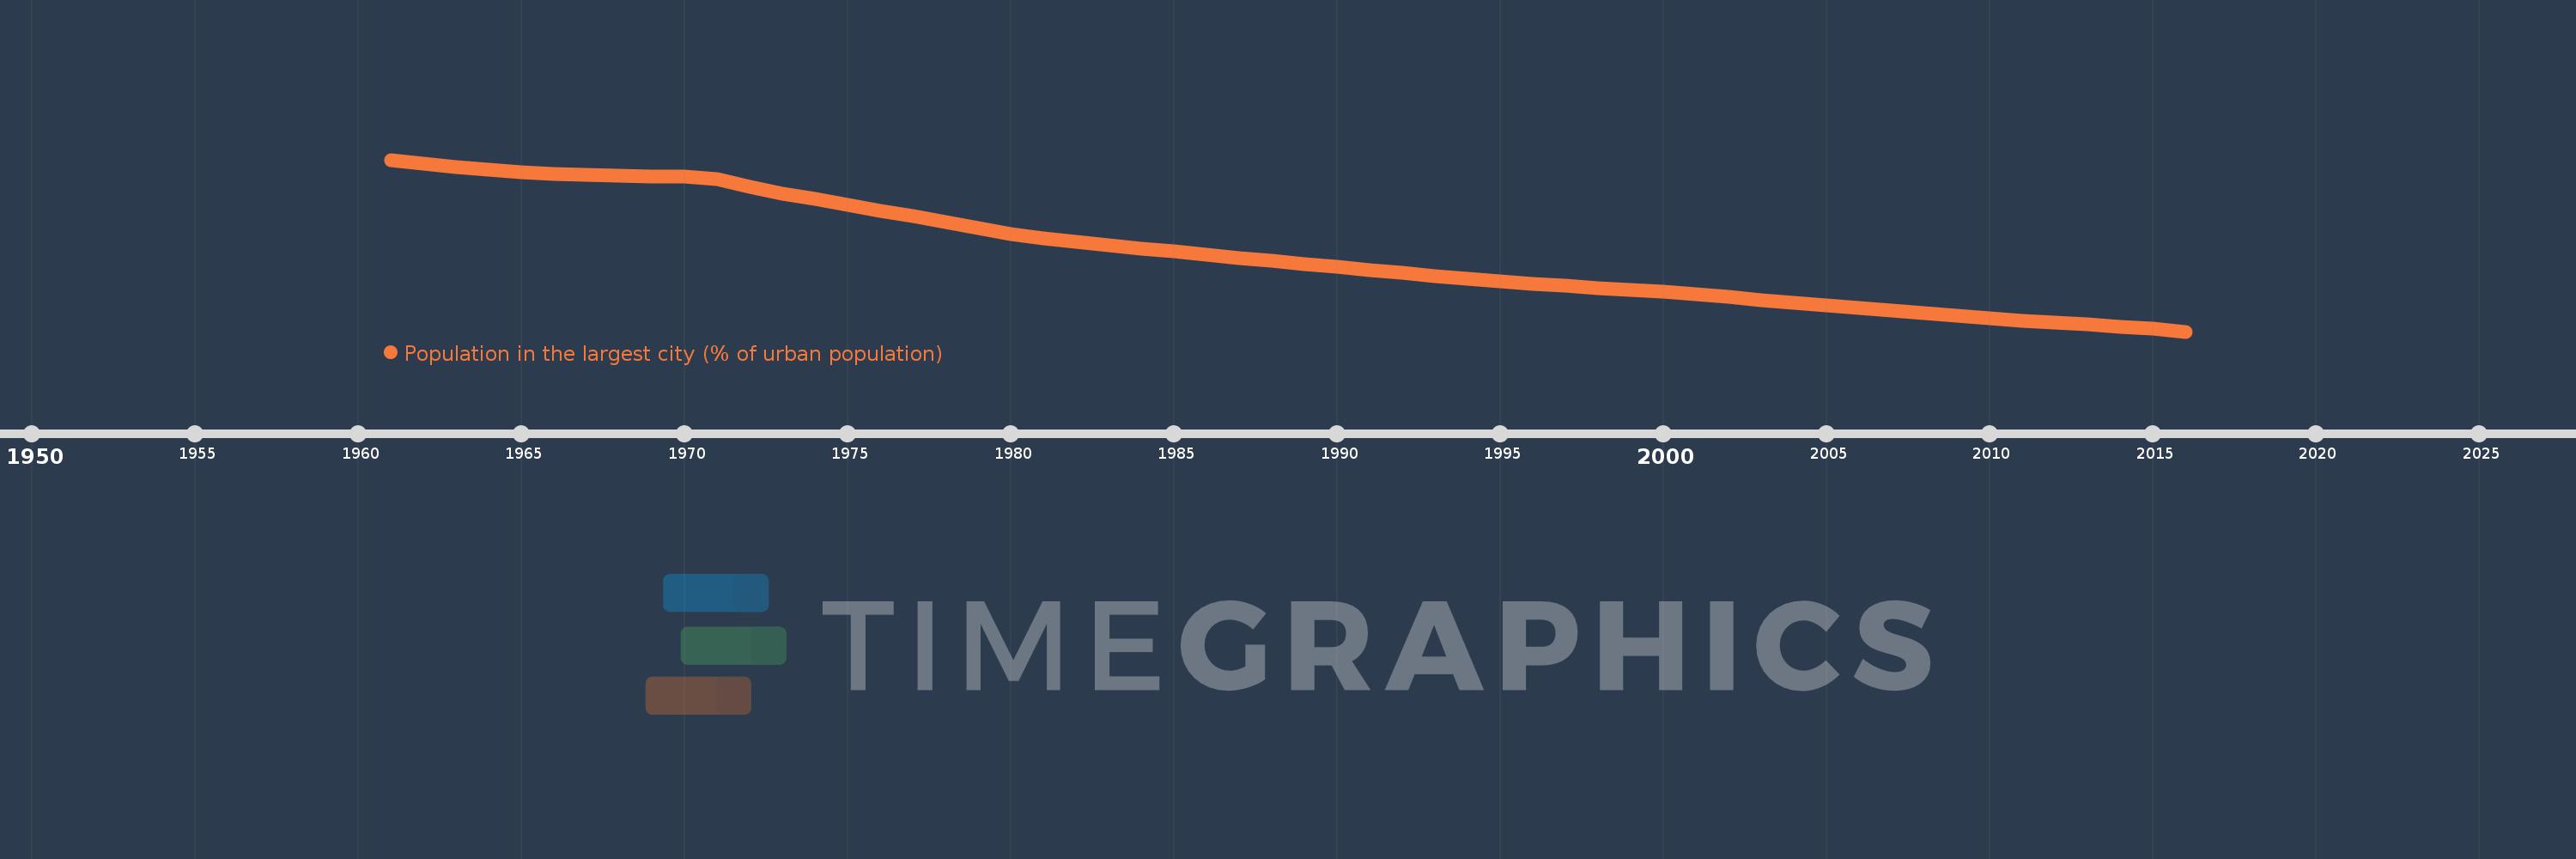
Population in the largest city (% of urban population)
2016,2015,2014,2013,2012,2011,2010,2009,2008,2007,2006,2005,2004,2003,2002,2001,2000,1999,1998,1997,1996,1995,1994,1993,1992,1991,1990,1989,1988,1987,1986,1985,1984,1983,1982,1981,1980,1979,1978,1977,1976,1975,1974,1973,1972,1971,1970,1969,1968,1967,1966,1965,1964,1963,1962,1961
Cette statistique dans les autres pays:
AfghanistanAlbaniaAlgeriaAngolaArab WorldArgentinaArmeniaAustraliaAustriaAzerbaijanBahrainBangladeshBelarusBelgiumBeninBoliviaBosnia and HerzegovinaBrazilBulgariaBurkina FasoBurundiCambodiaCameroonCanadaCentral African RepublicCentral Europe and the BalticsChadChileChinaColombiaCongo, Dem. Rep.Congo, Rep.Costa RicaCote d'IvoireCroatiaCubaCzech RepublicDenmarkDjiboutiDominican RepublicEarly-demographic dividendEast Asia & PacificEast Asia & Pacific (excluding high income)East Asia & Pacific (IDA & IBRD countries)EcuadorEgypt, Arab Rep.El SalvadorEritreaEstoniaEthiopiaEuro areaEurope & Central AsiaEurope & Central Asia (excluding high income)Europe & Central Asia (IDA & IBRD countries)European UnionFinlandFragile and conflict affected situationsFranceGabonGambia, TheGeorgiaGermanyGhanaGreeceGuatemalaGuineaGuinea-BissauHaitiHeavily indebted poor countries (HIPC)High incomeHondurasHong Kong SAR, ChinaHungaryIBRD onlyIDA & IBRD totalIDA blendIDA onlyIDA totalIndiaIndonesiaIran, Islamic Rep.IraqIrelandIsraelItalyJamaicaJapanJordanKazakhstanKenyaKorea, Dem. People’s Rep.Korea, Rep.KuwaitKyrgyz RepublicLao PDRLate-demographic dividendLatin America & Caribbean Latin America & Caribbean (excluding high income)Latin America & the Caribbean (IDA & IBRD countries)LatviaLeast developed countries: UN classificationLebanonLiberiaLibyaLithuaniaLow & middle incomeLow incomeLower middle incomeMacao SAR, ChinaMacedonia, FYRMadagascarMalawiMalaysiaMaliMauritaniaMexicoMiddle East & North AfricaMiddle East & North Africa (excluding high income)Middle East & North Africa (IDA & IBRD countries)Middle incomeMoldovaMongoliaMoroccoMozambiqueMyanmarNamibiaNepalNetherlandsNew ZealandNicaraguaNigerNigeriaNorth AmericaNorwayOECD membersOmanPakistanPanamaPapua New GuineaParaguayPeruPhilippinesPolandPortugalPost-demographic dividendPre-demographic dividendPuerto RicoQatarRomaniaRussian FederationRwandaSaudi ArabiaSenegalSerbiaSierra LeoneSingaporeSlovak RepublicSomaliaSouth AfricaSouth AsiaSouth Asia (IDA & IBRD)South SudanSpainSri LankaSub-Saharan Africa Sub-Saharan Africa (excluding high income)Sub-Saharan Africa (IDA & IBRD countries)SudanSwedenSwitzerlandSyrian Arab RepublicTajikistanTanzaniaThailandTogoTunisiaTurkeyTurkmenistanUgandaUkraineUnited Arab EmiratesUnited KingdomUnited StatesUpper middle incomeUruguayUzbekistanVenezuela, RBVietnamWest Bank and GazaWorldYemen, Rep.ZambiaZimbabwe La ligne de temps
Cette échelle de temps montre un graphique de 1961 année à 2016 année United States. Les données jusqu'à 1960 année ne sont pas présentés. Quantité d'observations actuelles selon dates: 56.
Source (désignation):
Les indicateurs du développement mondiale
Source (organisation):
United Nations, World Urbanization Prospects.
Catégories:
Urban Development
Dernière mise à jour
23 avr. 2017
Les indicateurs de changement de valeurs selon les années
Minimum:
7.088
1 janv. 2016
Pour la date d''observation
Valeur
Changement absolu
Le changement par rapport à la valeur précédente
1 janv. 1961
11.2
+11.2
0.0%
1 janv. 1962
11.108
-0.091
-0.82%
1 janv. 1963
11.031
-0.077
-0.69%
1 janv. 1964
10.967
-0.065
-0.59%
1 janv. 1965
10.909
-0.058
-0.53%
1 janv. 1966
10.867
-0.042
-0.39%
1 janv. 1967
10.836
-0.031
-0.28%
1 janv. 1968
10.813
-0.023
-0.21%
1 janv. 1969
10.801
-0.012
-0.11%
1 janv. 1970
10.792
-0.009
-0.09%
1 janv. 1971
10.728
-0.064
-0.59%
1 janv. 1972
10.551
-0.177
-1.65%
1 janv. 1973
10.397
-0.154
-1.46%
1 janv. 1974
10.257
-0.14
-1.35%
1 janv. 1975
10.123
-0.134
-1.31%
1 janv. 1976
9.983
-0.139
-1.38%
1 janv. 1977
9.849
-0.134
-1.34%
1 janv. 1978
9.712
-0.138
-1.4%
1 janv. 1979
9.571
-0.141
-1.45%
1 janv. 1980
9.428
-0.143
-1.49%
1 janv. 1981
9.311
-0.116
-1.23%
1 janv. 1982
9.228
-0.084
-0.9%
1 janv. 1983
9.148
-0.08
-0.87%
1 janv. 1984
9.072
-0.076
-0.83%
1 janv. 1985
9.001
-0.071
-0.78%
1 janv. 1986
8.93
-0.072
-0.8%
1 janv. 1987
8.855
-0.075
-0.83%
1 janv. 1988
8.784
-0.071
-0.8%
1 janv. 1989
8.712
-0.072
-0.82%
1 janv. 1990
8.638
-0.074
-0.85%
1 janv. 1991
8.558
-0.08
-0.93%
1 janv. 1992
8.487
-0.071
-0.83%
1 janv. 1993
8.414
-0.073
-0.87%
1 janv. 1994
8.347
-0.067
-0.79%
1 janv. 1995
8.289
-0.058
-0.69%
1 janv. 1996
8.236
-0.054
-0.65%
1 janv. 1997
8.186
-0.05
-0.61%
1 janv. 1998
8.133
-0.053
-0.64%
1 janv. 1999
8.084
-0.049
-0.6%
1 janv. 2000
8.038
-0.046
-0.57%
1 janv. 2001
7.986
-0.052
-0.65%
1 janv. 2002
7.913
-0.072
-0.9%
1 janv. 2003
7.847
-0.066
-0.84%
1 janv. 2004
7.786
-0.06
-0.77%
1 janv. 2005
7.721
-0.065
-0.83%
1 janv. 2006
7.658
-0.064
-0.83%
1 janv. 2007
7.591
-0.067
-0.87%
1 janv. 2008
7.526
-0.065
-0.85%
1 janv. 2009
7.462
-0.064
-0.85%
1 janv. 2010
7.404
-0.058
-0.78%
1 janv. 2011
7.35
-0.054
-0.73%
1 janv. 2012
7.301
-0.049
-0.66%
1 janv. 2013
7.253
-0.048
-0.66%
1 janv. 2014
7.207
-0.046
-0.64%
1 janv. 2015
7.157
-0.049
-0.68%
1 janv. 2016
7.088
-0.07
-0.97%
Classement des pays selon les statistiques actuelles par années


Commentaires: