29
/fr/
fr
AIzaSyAYiBZKx7MnpbEhh9jyipgxe19OcubqV5w
April 1, 2024
239226
Sierra Leone
SLE
true
2
1
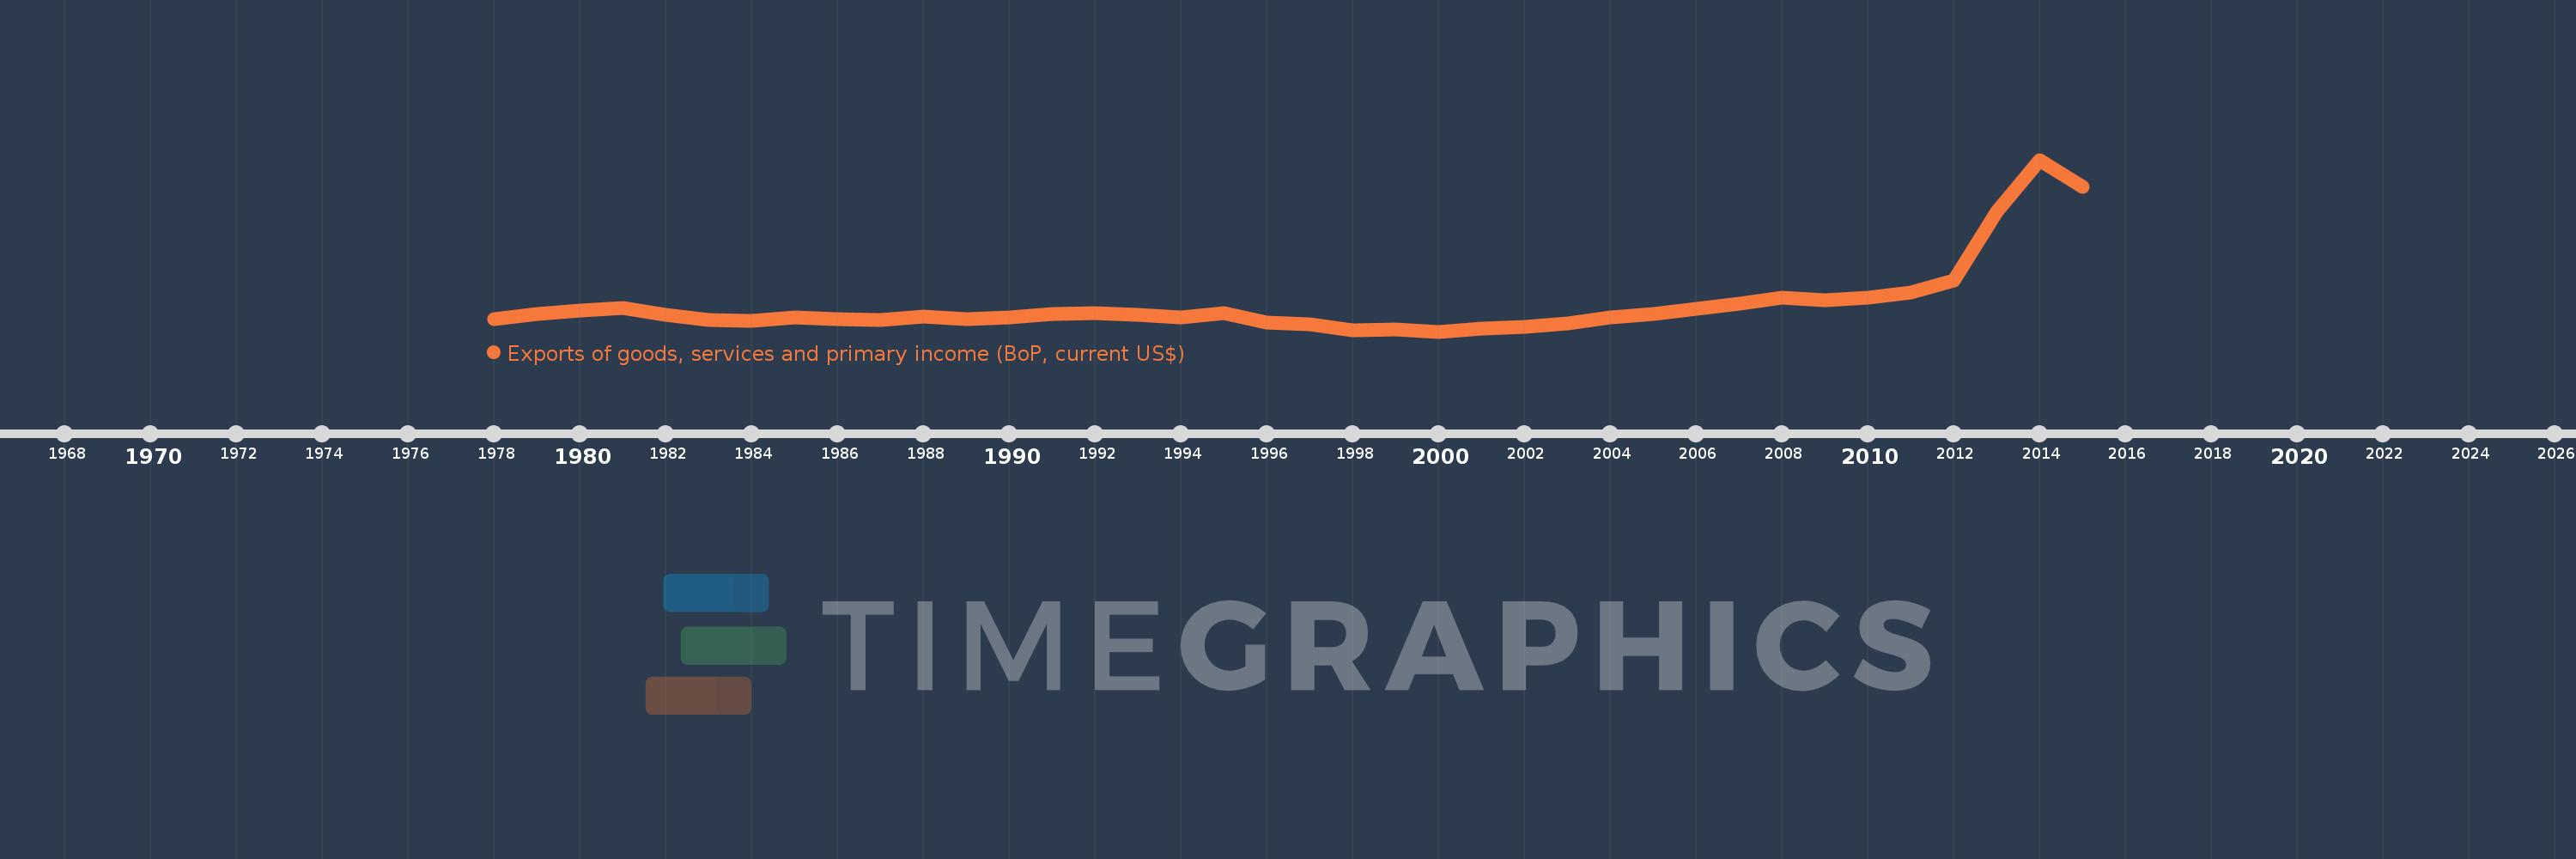
Exports of goods, services and primary income (BoP, current US$)
2015,2014,2013,2012,2011,2010,2009,2008,2007,2006,2005,2004,2003,2002,2001,2000,1999,1998,1997,1996,1995,1994,1993,1992,1991,1990,1989,1988,1987,1986,1985,1984,1983,1982,1981,1980,1979,1978
Cette statistique dans les autres pays:
AfghanistanAlbaniaAlgeriaAngolaAntigua and BarbudaArab WorldArgentinaArmeniaArubaAustraliaAustriaAzerbaijanBahamas, TheBahrainBangladeshBarbadosBelarusBelgiumBelizeBeninBermudaBhutanBoliviaBosnia and HerzegovinaBotswanaBrazilBrunei DarussalamBulgariaBurkina FasoBurundiCabo VerdeCambodiaCameroonCanadaCaribbean small statesCentral African RepublicCentral Europe and the BalticsChadChileChinaColombiaComorosCongo, Dem. Rep.Congo, Rep.Costa RicaCote d'IvoireCroatiaCuracaoCyprusCzech RepublicDenmarkDjiboutiDominicaDominican RepublicEarly-demographic dividendEast Asia & PacificEast Asia & Pacific (excluding high income)East Asia & Pacific (IDA & IBRD countries)EcuadorEgypt, Arab Rep.El SalvadorEquatorial GuineaEritreaEstoniaEthiopiaEuro areaEurope & Central AsiaEurope & Central Asia (excluding high income)Europe & Central Asia (IDA & IBRD countries)European UnionFaroe IslandsFijiFinlandFragile and conflict affected situationsFranceFrench PolynesiaGabonGambia, TheGeorgiaGermanyGhanaGreeceGrenadaGuatemalaGuineaGuinea-BissauGuyanaHaitiHeavily indebted poor countries (HIPC)High incomeHondurasHong Kong SAR, ChinaHungaryIBRD onlyIcelandIDA & IBRD totalIDA blendIDA onlyIDA totalIndiaIndonesiaIran, Islamic Rep.IraqIrelandIsraelItalyJamaicaJapanJordanKazakhstanKenyaKiribatiKorea, Rep.KosovoKuwaitKyrgyz RepublicLao PDRLate-demographic dividendLatin America & Caribbean Latin America & Caribbean (excluding high income)Latin America & the Caribbean (IDA & IBRD countries)LatviaLeast developed countries: UN classificationLebanonLesothoLiberiaLibyaLithuaniaLow & middle incomeLow incomeLower middle incomeLuxembourgMacao SAR, ChinaMacedonia, FYRMadagascarMalawiMalaysiaMaldivesMaliMaltaMarshall IslandsMauritaniaMauritiusMexicoMicronesia, Fed. Sts.Middle East & North Africa (excluding high income)Middle East & North Africa (IDA & IBRD countries)Middle incomeMoldovaMongoliaMontenegroMoroccoMozambiqueMyanmarNamibiaNepalNetherlandsNew CaledoniaNicaraguaNigerNigeriaNorth AmericaNorwayOECD membersOmanPacific island small statesPakistanPalauPanamaPapua New GuineaParaguayPeruPhilippinesPolandPortugalPost-demographic dividendPre-demographic dividendQatarRomaniaRussian FederationRwandaSamoaSao Tome and PrincipeSaudi ArabiaSenegalSerbiaSeychellesSierra LeoneSingaporeSint Maarten (Dutch part)Slovak RepublicSloveniaSolomon IslandsSouth AfricaSouth AsiaSouth Asia (IDA & IBRD)South SudanSpainSri LankaSt. Kitts and NevisSt. LuciaSt. Vincent and the GrenadinesSub-Saharan Africa Sub-Saharan Africa (excluding high income)Sub-Saharan Africa (IDA & IBRD countries)SudanSurinameSwazilandSwedenSwitzerlandSyrian Arab RepublicTajikistanTanzaniaThailandTimor-LesteTogoTongaTrinidad and TobagoTunisiaTurkeyTuvaluUgandaUkraineUnited KingdomUnited StatesUpper middle incomeUruguayVanuatuVenezuela, RBVietnamWest Bank and GazaWorldYemen, Rep.ZambiaZimbabwe La ligne de temps
Cette échelle de temps montre un graphique de 1978 année à 2015 année Sierra Leone. Les données jusqu'à 1977 année ne sont pas présentés. Quantité d'observations actuelles selon dates: 38.
Source (désignation):
Les indicateurs du développement mondiale
Source (organisation):
International Monetary Fund, Balance of Payments Statistics Yearbook and data files.
Catégories:
Economy & Growth, External Debt, Trade
Dernière mise à jour
23 avr. 2017
Les indicateurs de changement de valeurs selon les années
Minimum:
34.817 mln.
1 janv. 2000
Maximum:
1.768 mds
1 janv. 2014
Pour la date d''observation
Valeur
Changement absolu
Le changement par rapport à la valeur précédente
1 janv. 1978
162.844 mln.
+162.844 mln.
0.0%
1 janv. 1979
211.644 mln.
+48.8 mln.
29.97%
1 janv. 1980
243.147 mln.
+31.504 mln.
14.89%
1 janv. 1981
276.053 mln.
+32.906 mln.
13.53%
1 janv. 1982
203.607 mln.
-72.447 mln.
-26.24%
1 janv. 1983
147.984 mln.
-55.623 mln.
-27.32%
1 janv. 1984
142.097 mln.
-5.887 mln.
-3.98%
1 janv. 1985
173.948 mln.
+31.851 mln.
22.41%
1 janv. 1986
160.066 mln.
-13.882 mln.
-7.98%
1 janv. 1987
152.671 mln.
-7.395 mln.
-4.62%
1 janv. 1988
183.006 mln.
+30.336 mln.
19.87%
1 janv. 1989
156.618 mln.
-26.388 mln.
-14.42%
1 janv. 1990
178.022 mln.
+21.404 mln.
13.67%
1 janv. 1991
210.347 mln.
+32.325 mln.
18.16%
1 janv. 1992
225.08 mln.
+14.733 mln.
7.0%
1 janv. 1993
204.238 mln.
-20.842 mln.
-9.26%
1 janv. 1994
179.078 mln.
-25.16 mln.
-12.32%
1 janv. 1995
217.636 mln.
+38.558 mln.
21.53%
1 janv. 1996
129.027 mln.
-88.609 mln.
-40.71%
1 janv. 1997
110.428 mln.
-18.599 mln.
-14.41%
1 janv. 1998
49.104 mln.
-61.324 mln.
-55.53%
1 janv. 1999
57.536 mln.
+8.431 mln.
17.17%
1 janv. 2000
34.817 mln.
-22.719 mln.
-39.49%
1 janv. 2001
62.47 mln.
+27.653 mln.
79.43%
1 janv. 2002
85.413 mln.
+22.943 mln.
36.73%
1 janv. 2003
116.441 mln.
+31.028 mln.
36.33%
1 janv. 2004
178.534 mln.
+62.093 mln.
53.33%
1 janv. 2005
211.709 mln.
+33.176 mln.
18.58%
1 janv. 2006
267.166 mln.
+55.457 mln.
26.19%
1 janv. 2007
314.854 mln.
+47.688 mln.
17.85%
1 janv. 2008
373.84 mln.
+58.986 mln.
18.73%
1 janv. 2009
348.113 mln.
-25.727 mln.
-6.88%
1 janv. 2010
379.564 mln.
+31.451 mln.
9.03%
1 janv. 2011
426.526 mln.
+46.962 mln.
12.37%
1 janv. 2012
547.666 mln.
+121.14 mln.
28.4%
1 janv. 2013
1.243 mds
+694.984 mln.
126.9%
1 janv. 2014
1.768 mds
+525.814 mln.
42.31%
1 janv. 2015
1.494 mds
-274.921 mln.
-15.55%
Classement des pays selon les statistiques actuelles par années


Commentaires: