29
/fr/
fr
AIzaSyAYiBZKx7MnpbEhh9jyipgxe19OcubqV5w
April 1, 2024
210300
Nicaragua
NIC
true
2
1
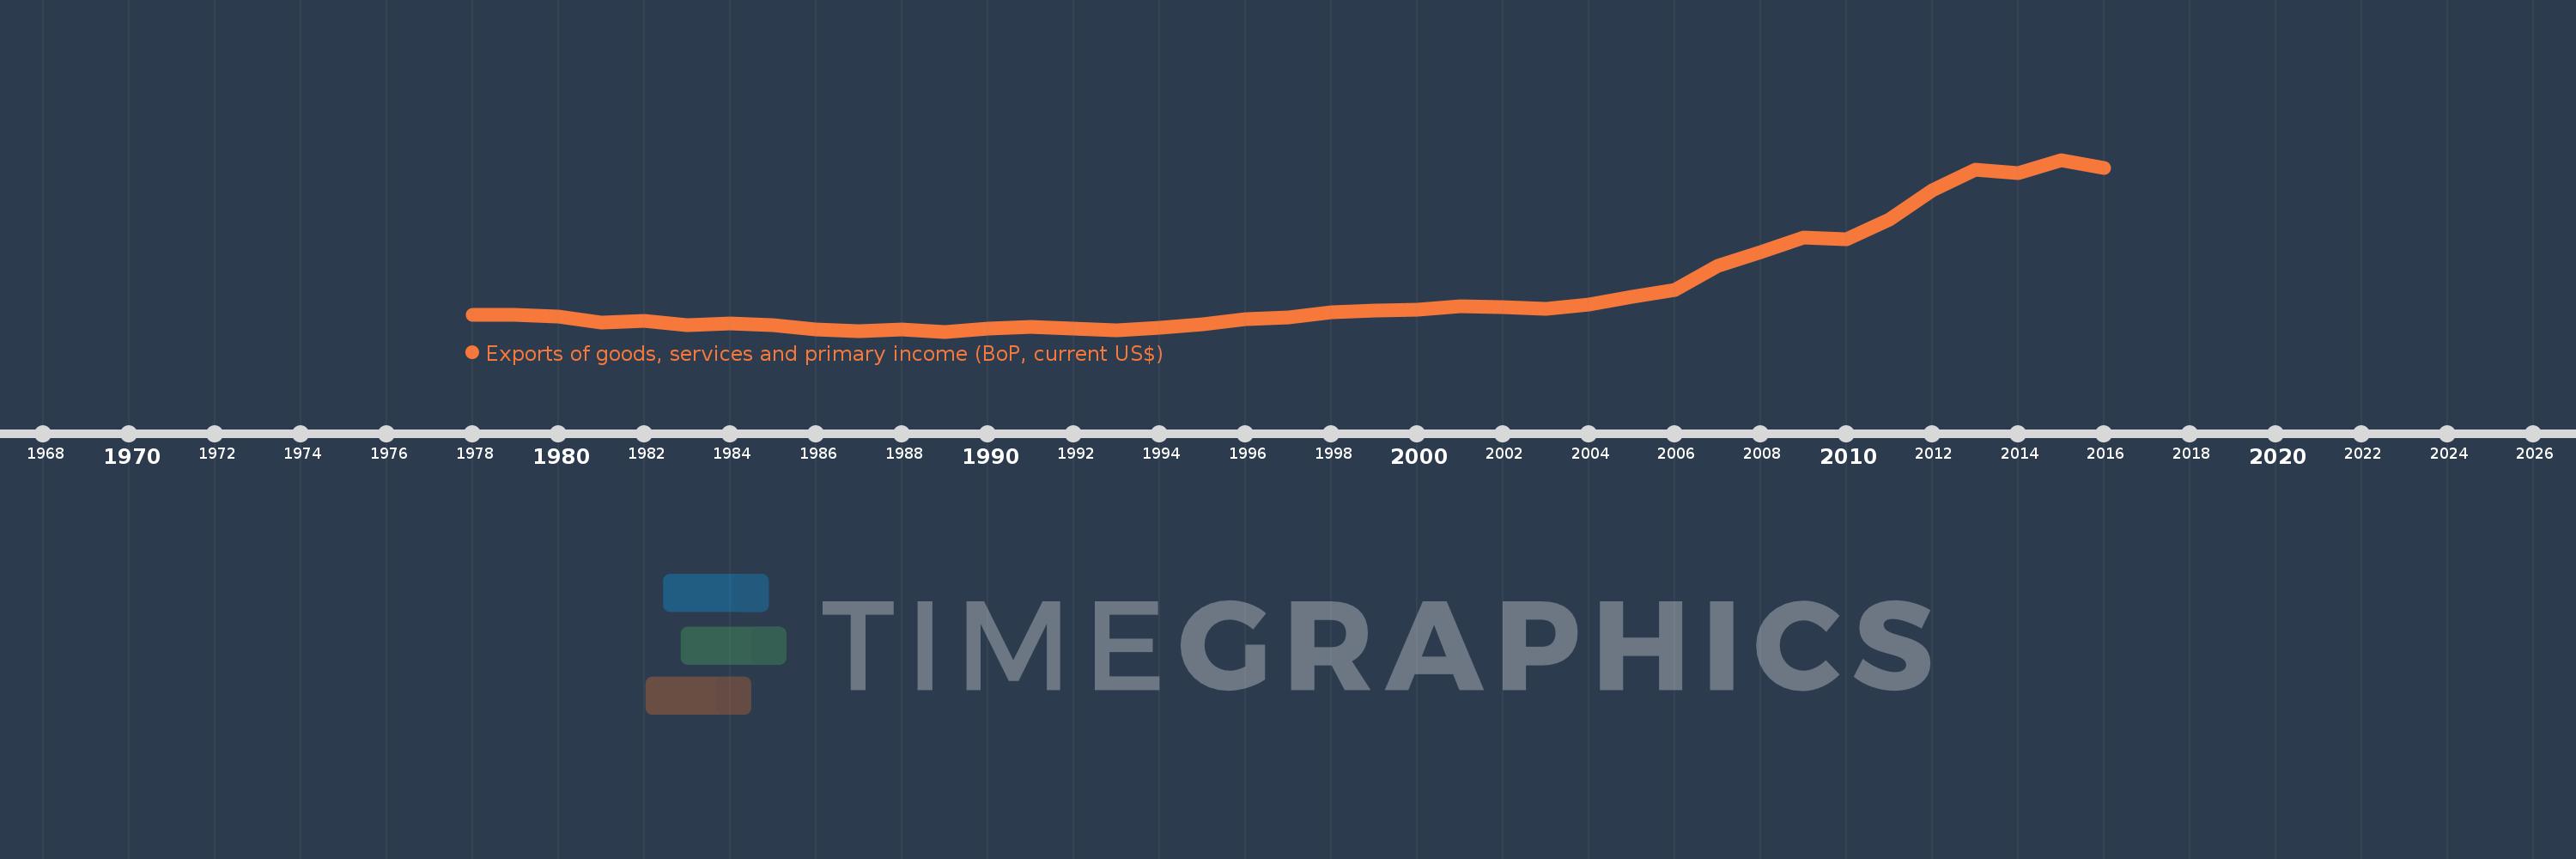
Exports of goods, services and primary income (BoP, current US$)
2016,2015,2014,2013,2012,2011,2010,2009,2008,2007,2006,2005,2004,2003,2002,2001,2000,1999,1998,1997,1996,1995,1994,1993,1992,1991,1990,1989,1988,1987,1986,1985,1984,1983,1982,1981,1980,1979,1978
Cette statistique dans les autres pays:
AfghanistanAlbaniaAlgeriaAngolaAntigua and BarbudaArab WorldArgentinaArmeniaArubaAustraliaAustriaAzerbaijanBahamas, TheBahrainBangladeshBarbadosBelarusBelgiumBelizeBeninBermudaBhutanBoliviaBosnia and HerzegovinaBotswanaBrazilBrunei DarussalamBulgariaBurkina FasoBurundiCabo VerdeCambodiaCameroonCanadaCaribbean small statesCentral African RepublicCentral Europe and the BalticsChadChileChinaColombiaComorosCongo, Dem. Rep.Congo, Rep.Costa RicaCote d'IvoireCroatiaCuracaoCyprusCzech RepublicDenmarkDjiboutiDominicaDominican RepublicEarly-demographic dividendEast Asia & PacificEast Asia & Pacific (excluding high income)East Asia & Pacific (IDA & IBRD countries)EcuadorEgypt, Arab Rep.El SalvadorEquatorial GuineaEritreaEstoniaEthiopiaEuro areaEurope & Central AsiaEurope & Central Asia (excluding high income)Europe & Central Asia (IDA & IBRD countries)European UnionFaroe IslandsFijiFinlandFragile and conflict affected situationsFranceFrench PolynesiaGabonGambia, TheGeorgiaGermanyGhanaGreeceGrenadaGuatemalaGuineaGuinea-BissauGuyanaHaitiHeavily indebted poor countries (HIPC)High incomeHondurasHong Kong SAR, ChinaHungaryIBRD onlyIcelandIDA & IBRD totalIDA blendIDA onlyIDA totalIndiaIndonesiaIran, Islamic Rep.IraqIrelandIsraelItalyJamaicaJapanJordanKazakhstanKenyaKiribatiKorea, Rep.KosovoKuwaitKyrgyz RepublicLao PDRLate-demographic dividendLatin America & Caribbean Latin America & Caribbean (excluding high income)Latin America & the Caribbean (IDA & IBRD countries)LatviaLeast developed countries: UN classificationLebanonLesothoLiberiaLibyaLithuaniaLow & middle incomeLow incomeLower middle incomeLuxembourgMacao SAR, ChinaMacedonia, FYRMadagascarMalawiMalaysiaMaldivesMaliMaltaMarshall IslandsMauritaniaMauritiusMexicoMicronesia, Fed. Sts.Middle East & North Africa (excluding high income)Middle East & North Africa (IDA & IBRD countries)Middle incomeMoldovaMongoliaMontenegroMoroccoMozambiqueMyanmarNamibiaNepalNetherlandsNew CaledoniaNicaraguaNigerNigeriaNorth AmericaNorwayOECD membersOmanPacific island small statesPakistanPalauPanamaPapua New GuineaParaguayPeruPhilippinesPolandPortugalPost-demographic dividendPre-demographic dividendQatarRomaniaRussian FederationRwandaSamoaSao Tome and PrincipeSaudi ArabiaSenegalSerbiaSeychellesSierra LeoneSingaporeSint Maarten (Dutch part)Slovak RepublicSloveniaSolomon IslandsSouth AfricaSouth AsiaSouth Asia (IDA & IBRD)South SudanSpainSri LankaSt. Kitts and NevisSt. LuciaSt. Vincent and the GrenadinesSub-Saharan Africa Sub-Saharan Africa (excluding high income)Sub-Saharan Africa (IDA & IBRD countries)SudanSurinameSwazilandSwedenSwitzerlandSyrian Arab RepublicTajikistanTanzaniaThailandTimor-LesteTogoTongaTrinidad and TobagoTunisiaTurkeyTuvaluUgandaUkraineUnited KingdomUnited StatesUpper middle incomeUruguayVanuatuVenezuela, RBVietnamWest Bank and GazaWorldYemen, Rep.ZambiaZimbabwe La ligne de temps
Cette échelle de temps montre un graphique de 1978 année à 2016 année Nicaragua. Les données jusqu'à 1977 année ne sont pas présentés. Quantité d'observations actuelles selon dates: 39.
Source (désignation):
Les indicateurs du développement mondiale
Source (organisation):
International Monetary Fund, Balance of Payments Statistics Yearbook and data files.
Catégories:
Economy & Growth, External Debt, Trade
Dernière mise à jour
23 avr. 2017
Les indicateurs de changement de valeurs selon les années
Minimum:
275.2 mln.
1 janv. 1989
Maximum:
5.031 mds
1 janv. 2015
Pour la date d''observation
Valeur
Changement absolu
Le changement par rapport à la valeur précédente
1 janv. 1978
732.9 mln.
+732.9 mln.
0.0%
1 janv. 1979
731.9 mln.
-1000.0 milles
-0.14%
1 janv. 1980
683.2 mln.
-48.7 mln.
-6.65%
1 janv. 1981
514.0 mln.
-169.2 mln.
-24.77%
1 janv. 1982
581.6 mln.
+67.6 mln.
13.15%
1 janv. 1983
455.5 mln.
-126.1 mln.
-21.68%
1 janv. 1984
504.5 mln.
+49.0 mln.
10.76%
1 janv. 1985
465.4 mln.
-39.1 mln.
-7.75%
1 janv. 1986
345.9 mln.
-119.5 mln.
-25.68%
1 janv. 1987
288.0 mln.
-57.9 mln.
-16.74%
1 janv. 1988
326.0 mln.
+38.0 mln.
13.19%
1 janv. 1989
275.2 mln.
-50.8 mln.
-15.58%
1 janv. 1990
347.5 mln.
+72.3 mln.
26.27%
1 janv. 1991
404.0 mln.
+56.5 mln.
16.26%
1 janv. 1992
348.0 mln.
-56.0 mln.
-13.86%
1 janv. 1993
316.8 mln.
-31.2 mln.
-8.97%
1 janv. 1994
372.6 mln.
+55.8 mln.
17.61%
1 janv. 1995
471.392 mln.
+98.792 mln.
26.51%
1 janv. 1996
620.621 mln.
+149.229 mln.
31.66%
1 janv. 1997
656.228 mln.
+35.607 mln.
5.74%
1 janv. 1998
813.834 mln.
+157.606 mln.
24.02%
1 janv. 1999
858.064 mln.
+44.23 mln.
5.43%
1 janv. 2000
871.822 mln.
+13.758 mln.
1.6%
1 janv. 2001
984.3 mln.
+112.478 mln.
12.9%
1 janv. 2002
945.3 mln.
-39.0 mln.
-3.96%
1 janv. 2003
913.6 mln.
-31.7 mln.
-3.35%
1 janv. 2004
1.02 mds
+105.9 mln.
11.59%
1 janv. 2005
1.234 mds
+215.0 mln.
21.09%
1 janv. 2006
1.434 mds
+199.33 mln.
16.15%
1 janv. 2007
2.097 mds
+662.77 mln.
46.22%
1 janv. 2008
2.469 mds
+372.5 mln.
17.77%
1 janv. 2009
2.876 mds
+406.9 mln.
16.48%
1 janv. 2010
2.838 mds
-37.5 mln.
-1.3%
1 janv. 2011
3.378 mds
+540.0 mln.
19.02%
1 janv. 2012
4.191 mds
+813.0 mln.
24.06%
1 janv. 2013
4.76 mds
+568.9 mln.
13.57%
1 janv. 2014
4.674 mds
-86.6 mln.
-1.82%
1 janv. 2015
5.031 mds
+357.0 mln.
7.64%
1 janv. 2016
4.802 mds
-228.8 mln.
-4.55%
Classement des pays selon les statistiques actuelles par années


Commentaires: