29
/fr/
fr
AIzaSyAYiBZKx7MnpbEhh9jyipgxe19OcubqV5w
April 1, 2024
126110
El Salvador
SLV
true
2
1
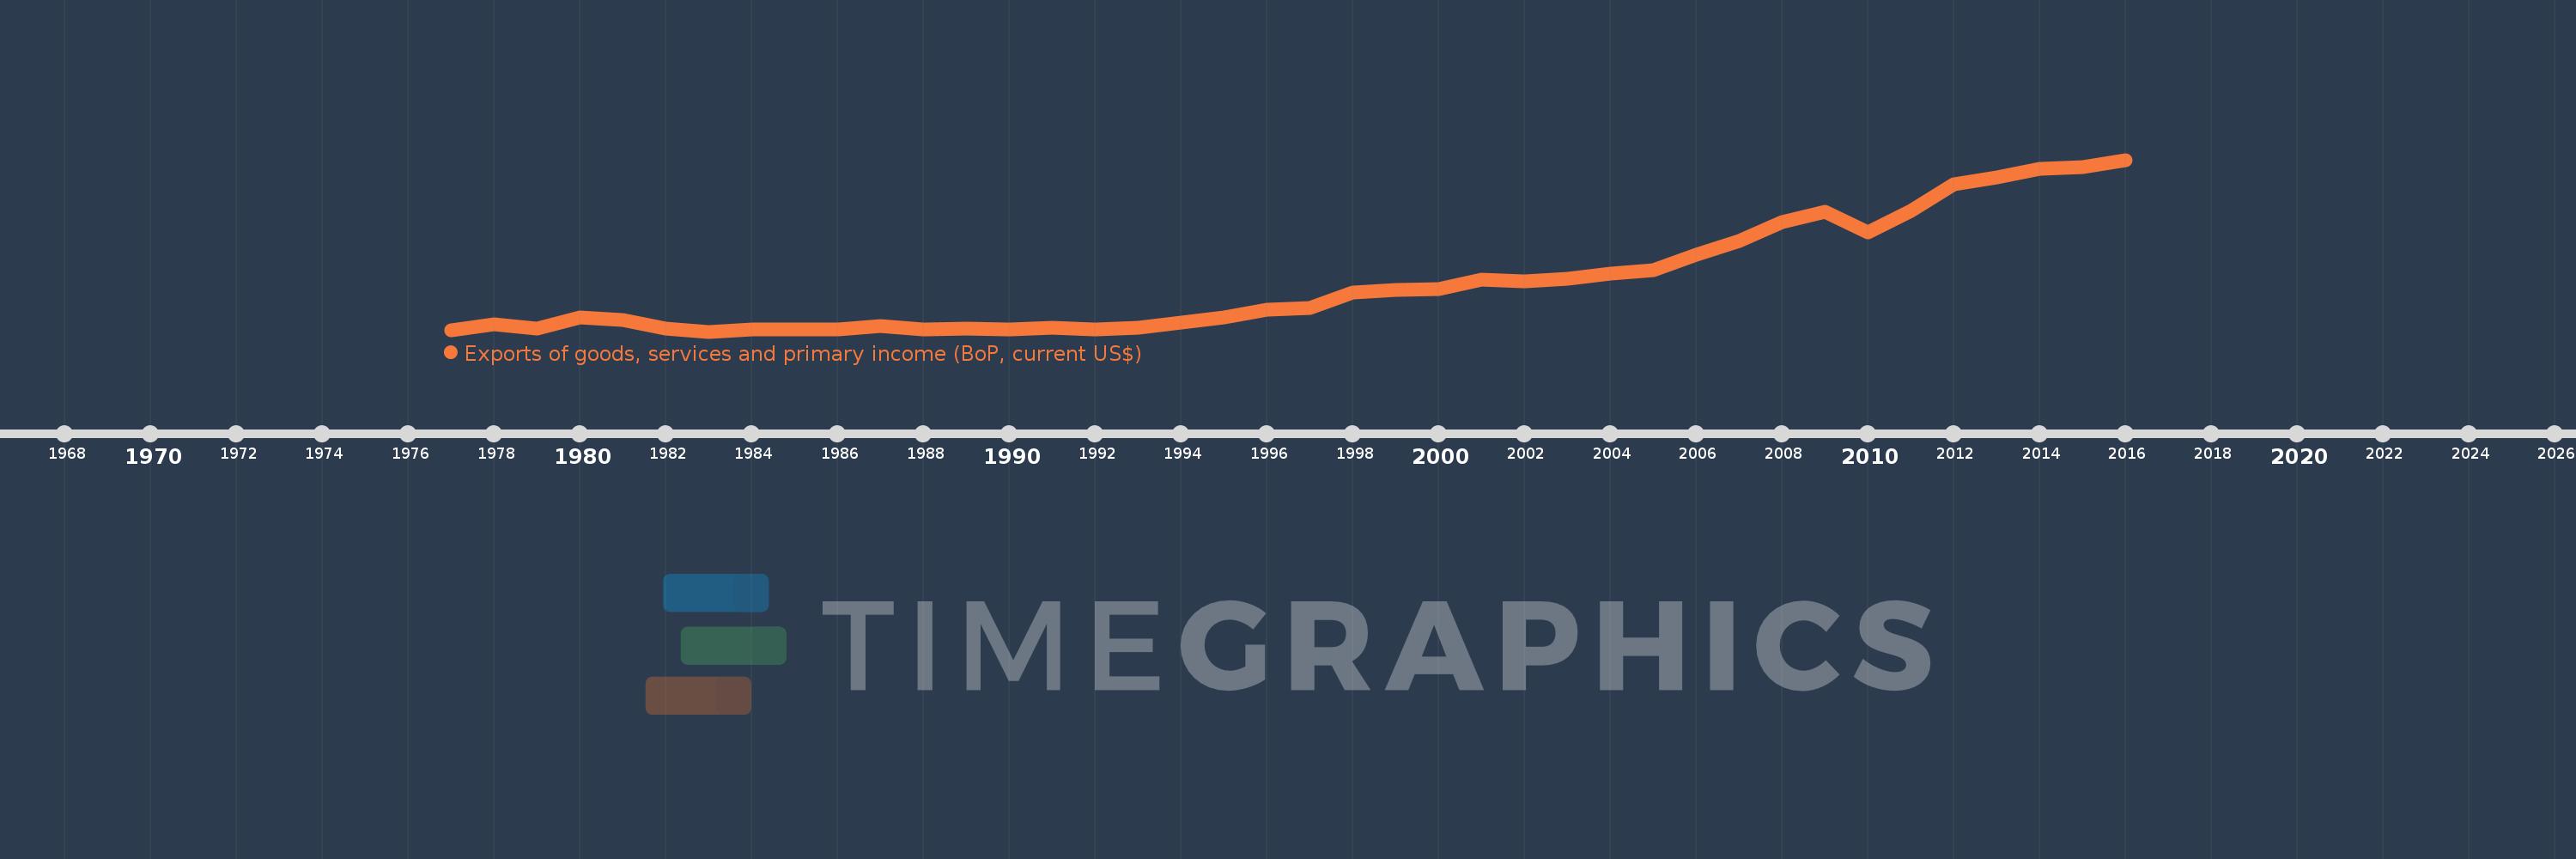
Exports of goods, services and primary income (BoP, current US$)
2016,2015,2014,2013,2012,2011,2010,2009,2008,2007,2006,2005,2004,2003,2002,2001,2000,1999,1998,1997,1996,1995,1994,1993,1992,1991,1990,1989,1988,1987,1986,1985,1984,1983,1982,1981,1980,1979,1978,1977
Cette statistique dans les autres pays:
AfghanistanAlbaniaAlgeriaAngolaAntigua and BarbudaArab WorldArgentinaArmeniaArubaAustraliaAustriaAzerbaijanBahamas, TheBahrainBangladeshBarbadosBelarusBelgiumBelizeBeninBermudaBhutanBoliviaBosnia and HerzegovinaBotswanaBrazilBrunei DarussalamBulgariaBurkina FasoBurundiCabo VerdeCambodiaCameroonCanadaCaribbean small statesCentral African RepublicCentral Europe and the BalticsChadChileChinaColombiaComorosCongo, Dem. Rep.Congo, Rep.Costa RicaCote d'IvoireCroatiaCuracaoCyprusCzech RepublicDenmarkDjiboutiDominicaDominican RepublicEarly-demographic dividendEast Asia & PacificEast Asia & Pacific (excluding high income)East Asia & Pacific (IDA & IBRD countries)EcuadorEgypt, Arab Rep.El SalvadorEquatorial GuineaEritreaEstoniaEthiopiaEuro areaEurope & Central AsiaEurope & Central Asia (excluding high income)Europe & Central Asia (IDA & IBRD countries)European UnionFaroe IslandsFijiFinlandFragile and conflict affected situationsFranceFrench PolynesiaGabonGambia, TheGeorgiaGermanyGhanaGreeceGrenadaGuatemalaGuineaGuinea-BissauGuyanaHaitiHeavily indebted poor countries (HIPC)High incomeHondurasHong Kong SAR, ChinaHungaryIBRD onlyIcelandIDA & IBRD totalIDA blendIDA onlyIDA totalIndiaIndonesiaIran, Islamic Rep.IraqIrelandIsraelItalyJamaicaJapanJordanKazakhstanKenyaKiribatiKorea, Rep.KosovoKuwaitKyrgyz RepublicLao PDRLate-demographic dividendLatin America & Caribbean Latin America & Caribbean (excluding high income)Latin America & the Caribbean (IDA & IBRD countries)LatviaLeast developed countries: UN classificationLebanonLesothoLiberiaLibyaLithuaniaLow & middle incomeLow incomeLower middle incomeLuxembourgMacao SAR, ChinaMacedonia, FYRMadagascarMalawiMalaysiaMaldivesMaliMaltaMarshall IslandsMauritaniaMauritiusMexicoMicronesia, Fed. Sts.Middle East & North Africa (excluding high income)Middle East & North Africa (IDA & IBRD countries)Middle incomeMoldovaMongoliaMontenegroMoroccoMozambiqueMyanmarNamibiaNepalNetherlandsNew CaledoniaNicaraguaNigerNigeriaNorth AmericaNorwayOECD membersOmanPacific island small statesPakistanPalauPanamaPapua New GuineaParaguayPeruPhilippinesPolandPortugalPost-demographic dividendPre-demographic dividendQatarRomaniaRussian FederationRwandaSamoaSao Tome and PrincipeSaudi ArabiaSenegalSerbiaSeychellesSierra LeoneSingaporeSint Maarten (Dutch part)Slovak RepublicSloveniaSolomon IslandsSouth AfricaSouth AsiaSouth Asia (IDA & IBRD)South SudanSpainSri LankaSt. Kitts and NevisSt. LuciaSt. Vincent and the GrenadinesSub-Saharan Africa Sub-Saharan Africa (excluding high income)Sub-Saharan Africa (IDA & IBRD countries)SudanSurinameSwazilandSwedenSwitzerlandSyrian Arab RepublicTajikistanTanzaniaThailandTimor-LesteTogoTongaTrinidad and TobagoTunisiaTurkeyTuvaluUgandaUkraineUnited KingdomUnited StatesUpper middle incomeUruguayVanuatuVenezuela, RBVietnamWest Bank and GazaWorldYemen, Rep.ZambiaZimbabwe La ligne de temps
Cette échelle de temps montre un graphique de 1977 année à 2016 année El Salvador. Les données jusqu'à 1976 année ne sont pas présentés. Quantité d'observations actuelles selon dates: 40.
Source (désignation):
Les indicateurs du développement mondiale
Source (organisation):
International Monetary Fund, Balance of Payments Statistics Yearbook and data files.
Catégories:
Economy & Growth, External Debt, Trade
Dernière mise à jour
23 avr. 2017
Les indicateurs de changement de valeurs selon les années
Minimum:
867.84 mln.
1 janv. 1983
Maximum:
6.791 mds
1 janv. 2016
Pour la date d''observation
Valeur
Changement absolu
Le changement par rapport à la valeur précédente
1 janv. 1977
899.64 mln.
+899.64 mln.
0.0%
1 janv. 1978
1.126 mds
+226.76 mln.
25.21%
1 janv. 1979
959.6 mln.
-166.8 mln.
-14.81%
1 janv. 1980
1.356 mds
+396.08 mln.
41.28%
1 janv. 1981
1.271 mds
-84.92 mln.
-6.26%
1 janv. 1982
970.2 mln.
-300.56 mln.
-23.65%
1 janv. 1983
867.84 mln.
-102.36 mln.
-10.55%
1 janv. 1984
930.84 mln.
+63.0 mln.
7.26%
1 janv. 1985
954.24 mln.
+23.4 mln.
2.51%
1 janv. 1986
951.36 mln.
-2.88 mln.
-0.3%
1 janv. 1987
1.056 mds
+104.502 mln.
10.98%
1 janv. 1988
950.66 mln.
-105.202 mln.
-9.96%
1 janv. 1989
962.82 mln.
+12.16 mln.
1.28%
1 janv. 1990
934.58 mln.
-28.24 mln.
-2.93%
1 janv. 1991
1.003 mds
+68.0 mln.
7.28%
1 janv. 1992
927.954 mln.
-74.625 mln.
-7.44%
1 janv. 1993
1.007 mds
+79.003 mln.
8.51%
1 janv. 1994
1.178 mds
+171.209 mln.
17.0%
1 janv. 1995
1.352 mds
+174.032 mln.
14.77%
1 janv. 1996
1.621 mds
+268.781 mln.
19.88%
1 janv. 1997
1.695 mds
+73.938 mln.
4.56%
1 janv. 1998
2.224 mds
+529.208 mln.
31.22%
1 janv. 1999
2.313 mds
+88.382 mln.
3.97%
1 janv. 2000
2.333 mds
+20.393 mln.
0.88%
1 janv. 2001
2.65 mds
+317.3 mln.
13.6%
1 janv. 2002
2.603 mds
-46.7 mln.
-1.76%
1 janv. 2003
2.68 mds
+76.1 mln.
2.92%
1 janv. 2004
2.862 mds
+182.392 mln.
6.81%
1 janv. 2005
2.976 mds
+114.058 mln.
3.99%
1 janv. 2006
3.517 mds
+540.78 mln.
18.17%
1 janv. 2007
4.005 mds
+488.24 mln.
13.88%
1 janv. 2008
4.657 mds
+652.31 mln.
16.29%
1 janv. 2009
4.989 mds
+331.62 mln.
7.12%
1 janv. 2010
4.293 mds
-696.235 mln.
-13.96%
1 janv. 2011
5.028 mds
+734.86 mln.
17.12%
1 janv. 2012
5.94 mds
+912.673 mln.
18.15%
1 janv. 2013
6.17 mds
+229.659 mln.
3.87%
1 janv. 2014
6.492 mds
+321.767 mln.
5.22%
1 janv. 2015
6.55 mds
+58.738 mln.
0.9%
1 janv. 2016
6.791 mds
+240.16 mln.
3.67%
Classement des pays selon les statistiques actuelles par années


Commentaires: