29
/fr/
fr
AIzaSyAYiBZKx7MnpbEhh9jyipgxe19OcubqV5w
April 1, 2024
194158
Mauritius
MUS
true
2
1
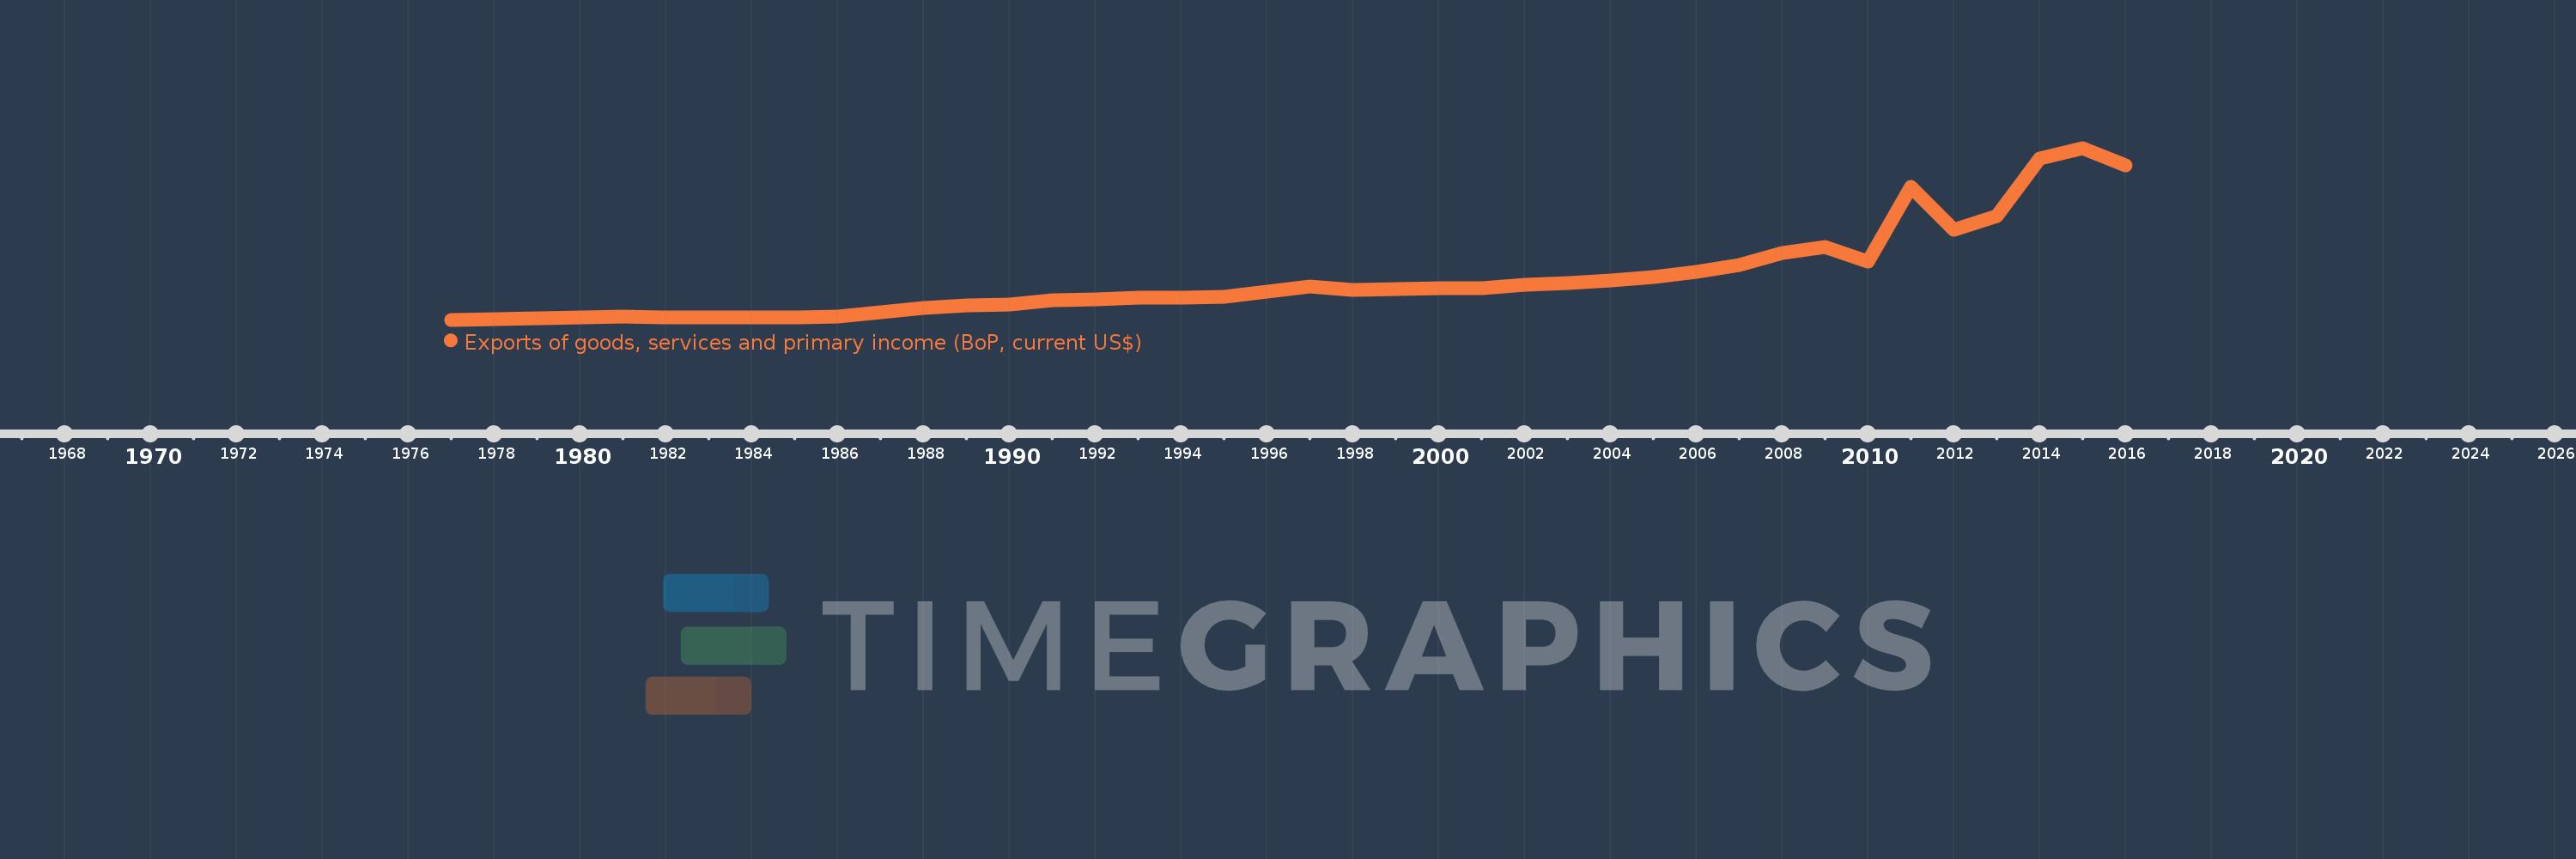
Exports of goods, services and primary income (BoP, current US$)
2016,2015,2014,2013,2012,2011,2010,2009,2008,2007,2006,2005,2004,2003,2002,2001,2000,1999,1998,1997,1996,1995,1994,1993,1992,1991,1990,1989,1988,1987,1986,1985,1984,1983,1982,1981,1980,1979,1978,1977
Cette statistique dans les autres pays:
AfghanistanAlbaniaAlgeriaAngolaAntigua and BarbudaArab WorldArgentinaArmeniaArubaAustraliaAustriaAzerbaijanBahamas, TheBahrainBangladeshBarbadosBelarusBelgiumBelizeBeninBermudaBhutanBoliviaBosnia and HerzegovinaBotswanaBrazilBrunei DarussalamBulgariaBurkina FasoBurundiCabo VerdeCambodiaCameroonCanadaCaribbean small statesCentral African RepublicCentral Europe and the BalticsChadChileChinaColombiaComorosCongo, Dem. Rep.Congo, Rep.Costa RicaCote d'IvoireCroatiaCuracaoCyprusCzech RepublicDenmarkDjiboutiDominicaDominican RepublicEarly-demographic dividendEast Asia & PacificEast Asia & Pacific (excluding high income)East Asia & Pacific (IDA & IBRD countries)EcuadorEgypt, Arab Rep.El SalvadorEquatorial GuineaEritreaEstoniaEthiopiaEuro areaEurope & Central AsiaEurope & Central Asia (excluding high income)Europe & Central Asia (IDA & IBRD countries)European UnionFaroe IslandsFijiFinlandFragile and conflict affected situationsFranceFrench PolynesiaGabonGambia, TheGeorgiaGermanyGhanaGreeceGrenadaGuatemalaGuineaGuinea-BissauGuyanaHaitiHeavily indebted poor countries (HIPC)High incomeHondurasHong Kong SAR, ChinaHungaryIBRD onlyIcelandIDA & IBRD totalIDA blendIDA onlyIDA totalIndiaIndonesiaIran, Islamic Rep.IraqIrelandIsraelItalyJamaicaJapanJordanKazakhstanKenyaKiribatiKorea, Rep.KosovoKuwaitKyrgyz RepublicLao PDRLate-demographic dividendLatin America & Caribbean Latin America & Caribbean (excluding high income)Latin America & the Caribbean (IDA & IBRD countries)LatviaLeast developed countries: UN classificationLebanonLesothoLiberiaLibyaLithuaniaLow & middle incomeLow incomeLower middle incomeLuxembourgMacao SAR, ChinaMacedonia, FYRMadagascarMalawiMalaysiaMaldivesMaliMaltaMarshall IslandsMauritaniaMauritiusMexicoMicronesia, Fed. Sts.Middle East & North Africa (excluding high income)Middle East & North Africa (IDA & IBRD countries)Middle incomeMoldovaMongoliaMontenegroMoroccoMozambiqueMyanmarNamibiaNepalNetherlandsNew CaledoniaNicaraguaNigerNigeriaNorth AmericaNorwayOECD membersOmanPacific island small statesPakistanPalauPanamaPapua New GuineaParaguayPeruPhilippinesPolandPortugalPost-demographic dividendPre-demographic dividendQatarRomaniaRussian FederationRwandaSamoaSao Tome and PrincipeSaudi ArabiaSenegalSerbiaSeychellesSierra LeoneSingaporeSint Maarten (Dutch part)Slovak RepublicSloveniaSolomon IslandsSouth AfricaSouth AsiaSouth Asia (IDA & IBRD)South SudanSpainSri LankaSt. Kitts and NevisSt. LuciaSt. Vincent and the GrenadinesSub-Saharan Africa Sub-Saharan Africa (excluding high income)Sub-Saharan Africa (IDA & IBRD countries)SudanSurinameSwazilandSwedenSwitzerlandSyrian Arab RepublicTajikistanTanzaniaThailandTimor-LesteTogoTongaTrinidad and TobagoTunisiaTurkeyTuvaluUgandaUkraineUnited KingdomUnited StatesUpper middle incomeUruguayVanuatuVenezuela, RBVietnamWest Bank and GazaWorldYemen, Rep.ZambiaZimbabwe La ligne de temps
Cette échelle de temps montre un graphique de 1977 année à 2016 année Mauritius. Les données jusqu'à 1976 année ne sont pas présentés. Quantité d'observations actuelles selon dates: 40.
Source (désignation):
Les indicateurs du développement mondiale
Source (organisation):
International Monetary Fund, Balance of Payments Statistics Yearbook and data files.
Catégories:
Economy & Growth, External Debt, Trade
Dernière mise à jour
23 avr. 2017
Les indicateurs de changement de valeurs selon les années
Minimum:
340.491 mln.
1 janv. 1977
Maximum:
13.075 mds
1 janv. 2015
Pour la date d''observation
Valeur
Changement absolu
Le changement par rapport à la valeur précédente
1 janv. 1977
340.491 mln.
+340.491 mln.
0.0%
1 janv. 1978
405.006 mln.
+64.515 mln.
18.95%
1 janv. 1979
443.109 mln.
+38.103 mln.
9.41%
1 janv. 1980
518.697 mln.
+75.589 mln.
17.06%
1 janv. 1981
578.583 mln.
+59.885 mln.
11.55%
1 janv. 1982
513.845 mln.
-64.738 mln.
-11.19%
1 janv. 1983
511.196 mln.
-2.65 mln.
-0.52%
1 janv. 1984
511.011 mln.
-184.367 milles
-0.04%
1 janv. 1985
509.336 mln.
-1.676 mln.
-0.33%
1 janv. 1986
576.656 mln.
+67.32 mln.
13.22%
1 janv. 1987
889.624 mln.
+312.968 mln.
54.27%
1 janv. 1988
1.225 mds
+335.468 mln.
37.71%
1 janv. 1989
1.406 mds
+180.503 mln.
14.73%
1 janv. 1990
1.449 mds
+43.476 mln.
3.09%
1 janv. 1991
1.778 mds
+328.778 mln.
22.69%
1 janv. 1992
1.864 mds
+86.413 mln.
4.86%
1 janv. 1993
2.003 mds
+138.924 mln.
7.45%
1 janv. 1994
1.971 mds
-32.54 mln.
-1.62%
1 janv. 1995
2.041 mds
+70.738 mln.
3.59%
1 janv. 1996
2.402 mds
+360.218 mln.
17.65%
1 janv. 1997
2.802 mds
+400.873 mln.
16.69%
1 janv. 1998
2.541 mds
-261.735 mln.
-9.34%
1 janv. 1999
2.634 mds
+93.359 mln.
3.67%
1 janv. 2000
2.668 mds
+33.674 mln.
1.28%
1 janv. 2001
2.671 mds
+3.266 mln.
0.12%
1 janv. 2002
2.925 mds
+254.377 mln.
9.52%
1 janv. 2003
3.03 mds
+104.455 mln.
3.57%
1 janv. 2004
3.225 mds
+195.335 mln.
6.45%
1 janv. 2005
3.5 mds
+275.268 mln.
8.53%
1 janv. 2006
3.899 mds
+398.84 mln.
11.39%
1 janv. 2007
4.374 mds
+474.719 mln.
12.17%
1 janv. 2008
5.259 mds
+885.401 mln.
20.24%
1 janv. 2009
5.748 mds
+488.242 mln.
9.28%
1 janv. 2010
4.635 mds
-1.113 mds
-19.36%
1 janv. 2011
10.189 mds
+5.553 mds
119.81%
1 janv. 2012
6.983 mds
-3.206 mds
-31.46%
1 janv. 2013
8.048 mds
+1.065 mds
15.25%
1 janv. 2014
12.268 mds
+4.22 mds
52.44%
1 janv. 2015
13.075 mds
+807.337 mln.
6.58%
1 janv. 2016
11.773 mds
-1.302 mds
-9.96%
Classement des pays selon les statistiques actuelles par années


Commentaires: