29
/fr/
fr
AIzaSyAYiBZKx7MnpbEhh9jyipgxe19OcubqV5w
April 1, 2024
135458
Gabon
GAB
true
2
1
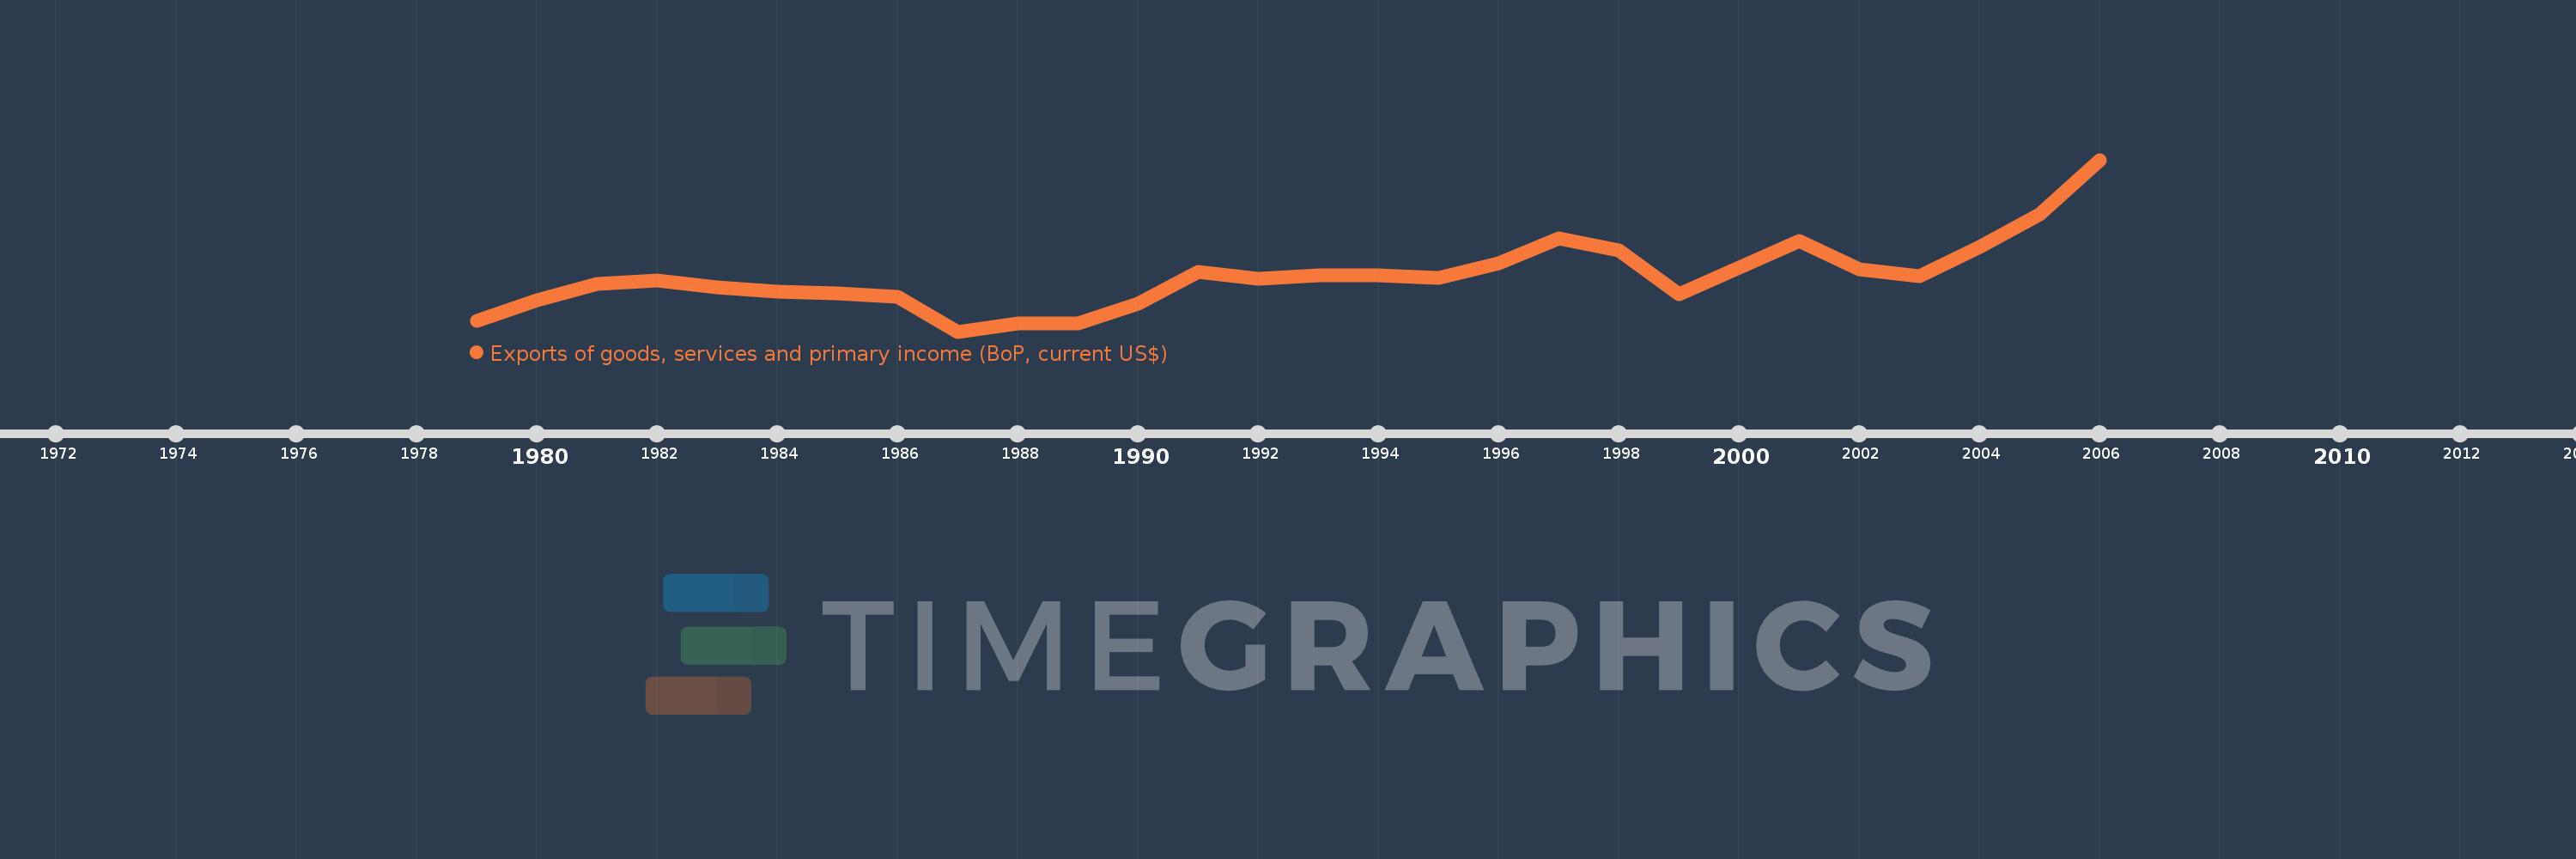
Exports of goods, services and primary income (BoP, current US$)
2006,2005,2004,2003,2002,2001,2000,1999,1998,1997,1996,1995,1994,1993,1992,1991,1990,1989,1988,1987,1986,1985,1984,1983,1982,1981,1980,1979
Cette statistique dans les autres pays:
AfghanistanAlbaniaAlgeriaAngolaAntigua and BarbudaArab WorldArgentinaArmeniaArubaAustraliaAustriaAzerbaijanBahamas, TheBahrainBangladeshBarbadosBelarusBelgiumBelizeBeninBermudaBhutanBoliviaBosnia and HerzegovinaBotswanaBrazilBrunei DarussalamBulgariaBurkina FasoBurundiCabo VerdeCambodiaCameroonCanadaCaribbean small statesCentral African RepublicCentral Europe and the BalticsChadChileChinaColombiaComorosCongo, Dem. Rep.Congo, Rep.Costa RicaCote d'IvoireCroatiaCuracaoCyprusCzech RepublicDenmarkDjiboutiDominicaDominican RepublicEarly-demographic dividendEast Asia & PacificEast Asia & Pacific (excluding high income)East Asia & Pacific (IDA & IBRD countries)EcuadorEgypt, Arab Rep.El SalvadorEquatorial GuineaEritreaEstoniaEthiopiaEuro areaEurope & Central AsiaEurope & Central Asia (excluding high income)Europe & Central Asia (IDA & IBRD countries)European UnionFaroe IslandsFijiFinlandFragile and conflict affected situationsFranceFrench PolynesiaGabonGambia, TheGeorgiaGermanyGhanaGreeceGrenadaGuatemalaGuineaGuinea-BissauGuyanaHaitiHeavily indebted poor countries (HIPC)High incomeHondurasHong Kong SAR, ChinaHungaryIBRD onlyIcelandIDA & IBRD totalIDA blendIDA onlyIDA totalIndiaIndonesiaIran, Islamic Rep.IraqIrelandIsraelItalyJamaicaJapanJordanKazakhstanKenyaKiribatiKorea, Rep.KosovoKuwaitKyrgyz RepublicLao PDRLate-demographic dividendLatin America & Caribbean Latin America & Caribbean (excluding high income)Latin America & the Caribbean (IDA & IBRD countries)LatviaLeast developed countries: UN classificationLebanonLesothoLiberiaLibyaLithuaniaLow & middle incomeLow incomeLower middle incomeLuxembourgMacao SAR, ChinaMacedonia, FYRMadagascarMalawiMalaysiaMaldivesMaliMaltaMarshall IslandsMauritaniaMauritiusMexicoMicronesia, Fed. Sts.Middle East & North Africa (excluding high income)Middle East & North Africa (IDA & IBRD countries)Middle incomeMoldovaMongoliaMontenegroMoroccoMozambiqueMyanmarNamibiaNepalNetherlandsNew CaledoniaNicaraguaNigerNigeriaNorth AmericaNorwayOECD membersOmanPacific island small statesPakistanPalauPanamaPapua New GuineaParaguayPeruPhilippinesPolandPortugalPost-demographic dividendPre-demographic dividendQatarRomaniaRussian FederationRwandaSamoaSao Tome and PrincipeSaudi ArabiaSenegalSerbiaSeychellesSierra LeoneSingaporeSint Maarten (Dutch part)Slovak RepublicSloveniaSolomon IslandsSouth AfricaSouth AsiaSouth Asia (IDA & IBRD)South SudanSpainSri LankaSt. Kitts and NevisSt. LuciaSt. Vincent and the GrenadinesSub-Saharan Africa Sub-Saharan Africa (excluding high income)Sub-Saharan Africa (IDA & IBRD countries)SudanSurinameSwazilandSwedenSwitzerlandSyrian Arab RepublicTajikistanTanzaniaThailandTimor-LesteTogoTongaTrinidad and TobagoTunisiaTurkeyTuvaluUgandaUkraineUnited KingdomUnited StatesUpper middle incomeUruguayVanuatuVenezuela, RBVietnamWest Bank and GazaWorldYemen, Rep.ZambiaZimbabwe La ligne de temps
Cette échelle de temps montre un graphique de 1979 année à 2006 année Gabon. Les données jusqu'à 1978 année ne sont pas présentés. Quantité d'observations actuelles selon dates: 28.
Source (désignation):
Les indicateurs du développement mondiale
Source (organisation):
International Monetary Fund, Balance of Payments Statistics Yearbook and data files.
Catégories:
Economy & Growth, External Debt, Trade
Dernière mise à jour
23 avr. 2017
Les indicateurs de changement de valeurs selon les années
Minimum:
1.216 mds
1 janv. 1987
Maximum:
5.639 mds
1 janv. 2006
Pour la date d''observation
Valeur
Changement absolu
Le changement par rapport à la valeur précédente
1 janv. 1979
1.483 mds
+1.483 mds
0.0%
1 janv. 1980
2.031 mds
+548.275 mln.
36.97%
1 janv. 1981
2.434 mds
+402.732 mln.
19.83%
1 janv. 1982
2.533 mds
+99.131 mln.
4.07%
1 janv. 1983
2.351 mds
-182.36 mln.
-7.2%
1 janv. 1984
2.244 mds
-106.477 mln.
-4.53%
1 janv. 1985
2.203 mds
-40.824 mln.
-1.82%
1 janv. 1986
2.119 mds
-84.261 mln.
-3.82%
1 janv. 1987
1.216 mds
-903.232 mln.
-42.62%
1 janv. 1988
1.417 mds
+201.304 mln.
16.56%
1 janv. 1989
1.424 mds
+6.513 mln.
0.46%
1 janv. 1990
1.934 mds
+510.315 mln.
35.84%
1 janv. 1991
2.75 mds
+816.417 mln.
42.21%
1 janv. 1992
2.58 mds
-170.538 mln.
-6.2%
1 janv. 1993
2.654 mds
+74.157 mln.
2.87%
1 janv. 1994
2.669 mds
+15.461 mln.
0.58%
1 janv. 1995
2.597 mds
-72.791 mln.
-2.73%
1 janv. 1996
2.978 mds
+381.781 mln.
14.7%
1 janv. 1997
3.609 mds
+630.391 mln.
21.16%
1 janv. 1998
3.304 mds
-305.368 mln.
-8.46%
1 janv. 1999
2.184 mds
-1.12 mds
-33.9%
1 janv. 2000
2.859 mds
+675.68 mln.
30.94%
1 janv. 2001
3.541 mds
+681.841 mln.
23.85%
1 janv. 2002
2.808 mds
-732.876 mln.
-20.7%
1 janv. 2003
2.651 mds
-157.566 mln.
-5.61%
1 janv. 2004
3.393 mds
+741.815 mln.
27.98%
1 janv. 2005
4.237 mds
+844.128 mln.
24.88%
1 janv. 2006
5.639 mds
+1.402 mds
33.09%
Classement des pays selon les statistiques actuelles par années


Commentaires: