29
/fr/
fr
AIzaSyAYiBZKx7MnpbEhh9jyipgxe19OcubqV5w
April 1, 2024
136659
Gambia, The
GMB
true
2
1
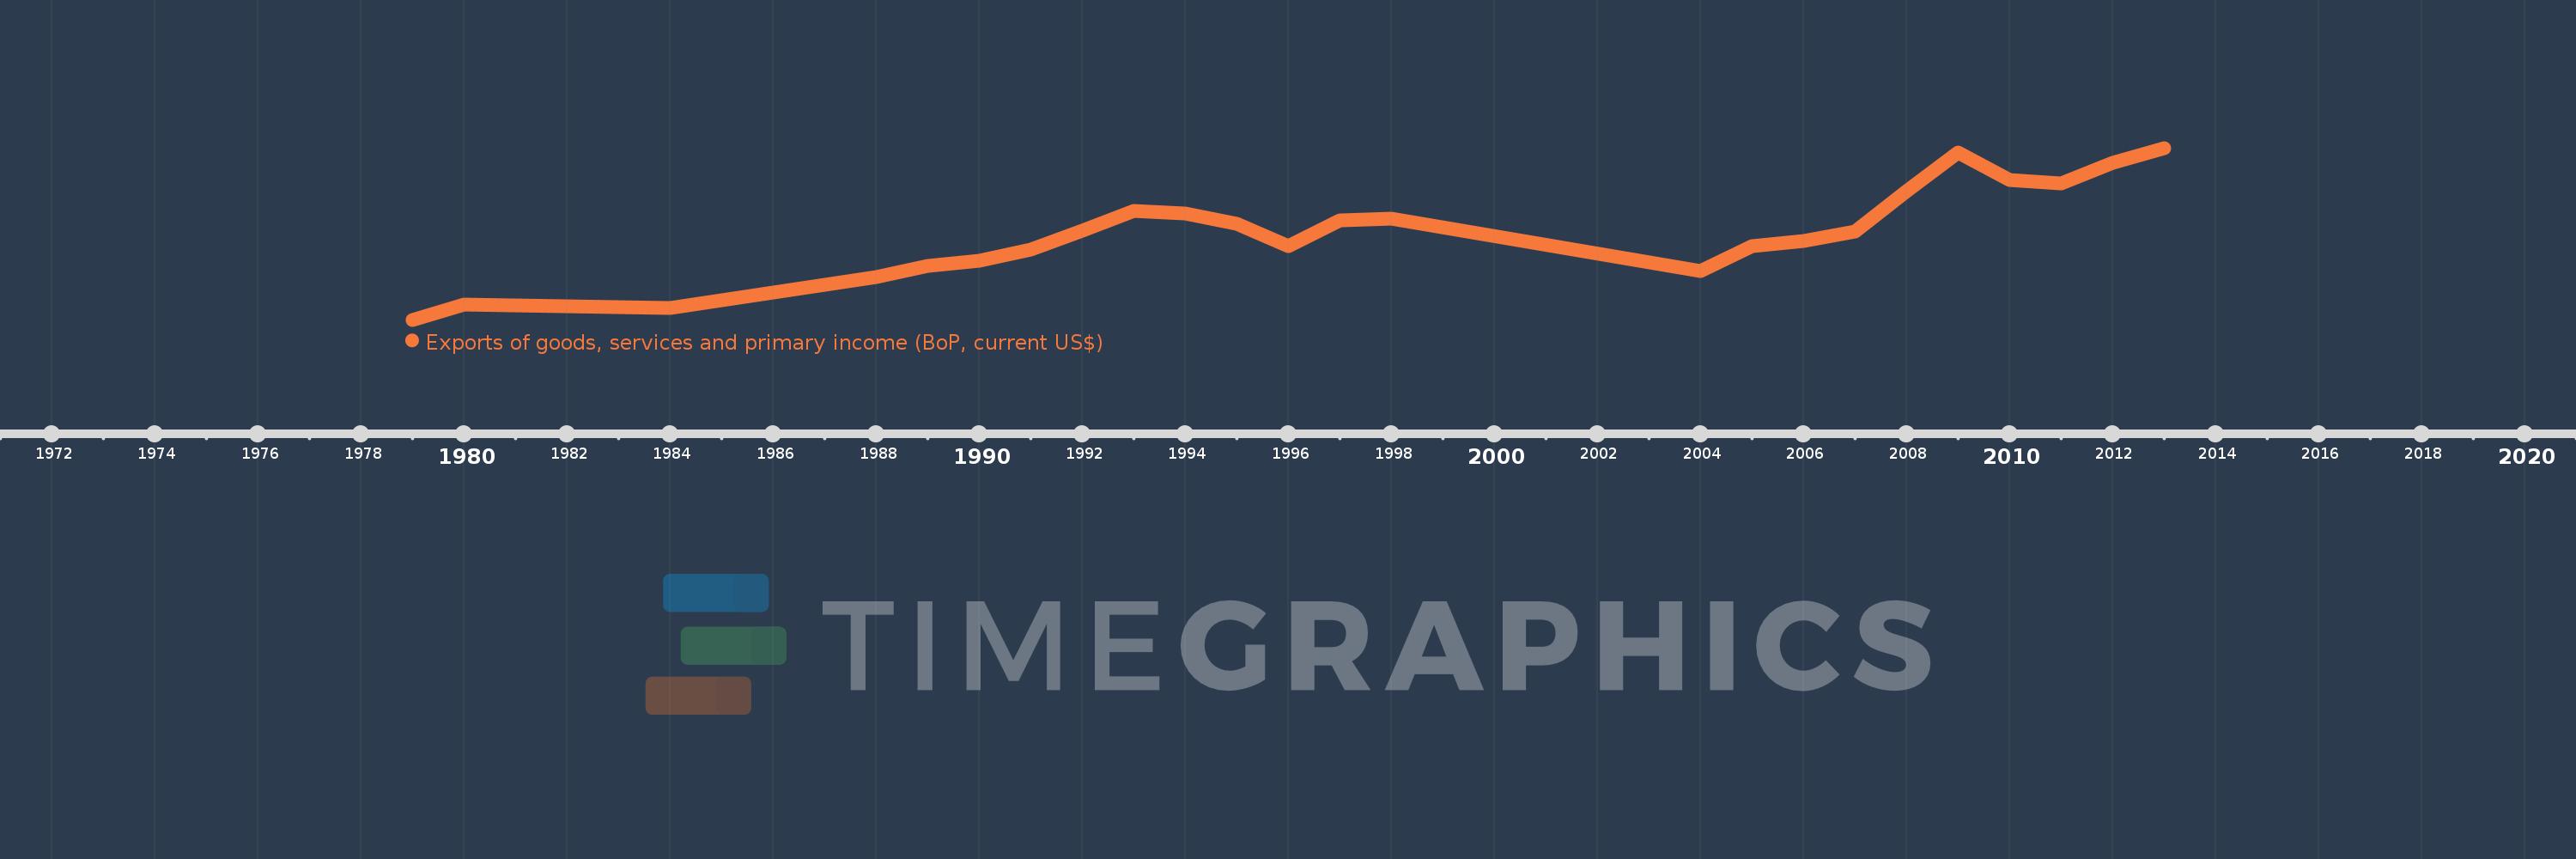
Exports of goods, services and primary income (BoP, current US$)
2013,2012,2011,2010,2009,2008,2007,2006,2005,2004,1998,1997,1996,1995,1994,1993,1992,1991,1990,1989,1988,1984,1983,1980,1979
Cette statistique dans les autres pays:
AfghanistanAlbaniaAlgeriaAngolaAntigua and BarbudaArab WorldArgentinaArmeniaArubaAustraliaAustriaAzerbaijanBahamas, TheBahrainBangladeshBarbadosBelarusBelgiumBelizeBeninBermudaBhutanBoliviaBosnia and HerzegovinaBotswanaBrazilBrunei DarussalamBulgariaBurkina FasoBurundiCabo VerdeCambodiaCameroonCanadaCaribbean small statesCentral African RepublicCentral Europe and the BalticsChadChileChinaColombiaComorosCongo, Dem. Rep.Congo, Rep.Costa RicaCote d'IvoireCroatiaCuracaoCyprusCzech RepublicDenmarkDjiboutiDominicaDominican RepublicEarly-demographic dividendEast Asia & PacificEast Asia & Pacific (excluding high income)East Asia & Pacific (IDA & IBRD countries)EcuadorEgypt, Arab Rep.El SalvadorEquatorial GuineaEritreaEstoniaEthiopiaEuro areaEurope & Central AsiaEurope & Central Asia (excluding high income)Europe & Central Asia (IDA & IBRD countries)European UnionFaroe IslandsFijiFinlandFragile and conflict affected situationsFranceFrench PolynesiaGabonGambia, TheGeorgiaGermanyGhanaGreeceGrenadaGuatemalaGuineaGuinea-BissauGuyanaHaitiHeavily indebted poor countries (HIPC)High incomeHondurasHong Kong SAR, ChinaHungaryIBRD onlyIcelandIDA & IBRD totalIDA blendIDA onlyIDA totalIndiaIndonesiaIran, Islamic Rep.IraqIrelandIsraelItalyJamaicaJapanJordanKazakhstanKenyaKiribatiKorea, Rep.KosovoKuwaitKyrgyz RepublicLao PDRLate-demographic dividendLatin America & Caribbean Latin America & Caribbean (excluding high income)Latin America & the Caribbean (IDA & IBRD countries)LatviaLeast developed countries: UN classificationLebanonLesothoLiberiaLibyaLithuaniaLow & middle incomeLow incomeLower middle incomeLuxembourgMacao SAR, ChinaMacedonia, FYRMadagascarMalawiMalaysiaMaldivesMaliMaltaMarshall IslandsMauritaniaMauritiusMexicoMicronesia, Fed. Sts.Middle East & North Africa (excluding high income)Middle East & North Africa (IDA & IBRD countries)Middle incomeMoldovaMongoliaMontenegroMoroccoMozambiqueMyanmarNamibiaNepalNetherlandsNew CaledoniaNicaraguaNigerNigeriaNorth AmericaNorwayOECD membersOmanPacific island small statesPakistanPalauPanamaPapua New GuineaParaguayPeruPhilippinesPolandPortugalPost-demographic dividendPre-demographic dividendQatarRomaniaRussian FederationRwandaSamoaSao Tome and PrincipeSaudi ArabiaSenegalSerbiaSeychellesSierra LeoneSingaporeSint Maarten (Dutch part)Slovak RepublicSloveniaSolomon IslandsSouth AfricaSouth AsiaSouth Asia (IDA & IBRD)South SudanSpainSri LankaSt. Kitts and NevisSt. LuciaSt. Vincent and the GrenadinesSub-Saharan Africa Sub-Saharan Africa (excluding high income)Sub-Saharan Africa (IDA & IBRD countries)SudanSurinameSwazilandSwedenSwitzerlandSyrian Arab RepublicTajikistanTanzaniaThailandTimor-LesteTogoTongaTrinidad and TobagoTunisiaTurkeyTuvaluUgandaUkraineUnited KingdomUnited StatesUpper middle incomeUruguayVanuatuVenezuela, RBVietnamWest Bank and GazaWorldYemen, Rep.ZambiaZimbabwe La ligne de temps
Cette échelle de temps montre un graphique de 1979 année à 2013 année Gambia, The. Les données jusqu'à 1978 année ne sont pas présentés. Quantité d'observations actuelles selon dates: 25.
Source (désignation):
Les indicateurs du développement mondiale
Source (organisation):
International Monetary Fund, Balance of Payments Statistics Yearbook and data files.
Catégories:
Economy & Growth, External Debt, Trade
Dernière mise à jour
23 avr. 2017
Les indicateurs de changement de valeurs selon les années
Minimum:
58.09 mln.
1 janv. 1979
Maximum:
343.753 mln.
1 janv. 2013
Pour la date d''observation
Valeur
Changement absolu
Le changement par rapport à la valeur précédente
1 janv. 1979
58.09 mln.
+58.09 mln.
0.0%
1 janv. 1980
82.747 mln.
+24.657 mln.
42.45%
1 janv. 1983
79.794 mln.
-2.952 mln.
-3.57%
1 janv. 1984
77.098 mln.
-2.696 mln.
-3.38%
1 janv. 1988
128.766 mln.
+51.667 mln.
67.01%
1 janv. 1989
147.601 mln.
+18.835 mln.
14.63%
1 janv. 1990
155.755 mln.
+8.154 mln.
5.52%
1 janv. 1991
175.13 mln.
+19.375 mln.
12.44%
1 janv. 1992
206.569 mln.
+31.439 mln.
17.95%
1 janv. 1993
238.935 mln.
+32.366 mln.
15.67%
1 janv. 1994
235.314 mln.
-3.621 mln.
-1.52%
1 janv. 1995
218.273 mln.
-17.041 mln.
-7.24%
1 janv. 1996
179.797 mln.
-38.476 mln.
-17.63%
1 janv. 1997
223.033 mln.
+43.236 mln.
24.05%
1 janv. 1998
226.667 mln.
+3.634 mln.
1.63%
1 janv. 2004
138.631 mln.
-88.036 mln.
-38.84%
1 janv. 2005
180.108 mln.
+41.477 mln.
29.92%
1 janv. 2006
189.766 mln.
+9.659 mln.
5.36%
1 janv. 2007
205.471 mln.
+15.705 mln.
8.28%
1 janv. 2008
271.26 mln.
+65.789 mln.
32.02%
1 janv. 2009
335.796 mln.
+64.536 mln.
23.79%
1 janv. 2010
290.084 mln.
-45.712 mln.
-13.61%
1 janv. 2011
284.918 mln.
-5.166 mln.
-1.78%
1 janv. 2012
318.914 mln.
+33.997 mln.
11.93%
1 janv. 2013
343.753 mln.
+24.839 mln.
7.79%
Classement des pays selon les statistiques actuelles par années


Commentaires: