29
/fr/
fr
AIzaSyAYiBZKx7MnpbEhh9jyipgxe19OcubqV5w
April 1, 2024
186446
Malawi
MWI
true
2
1
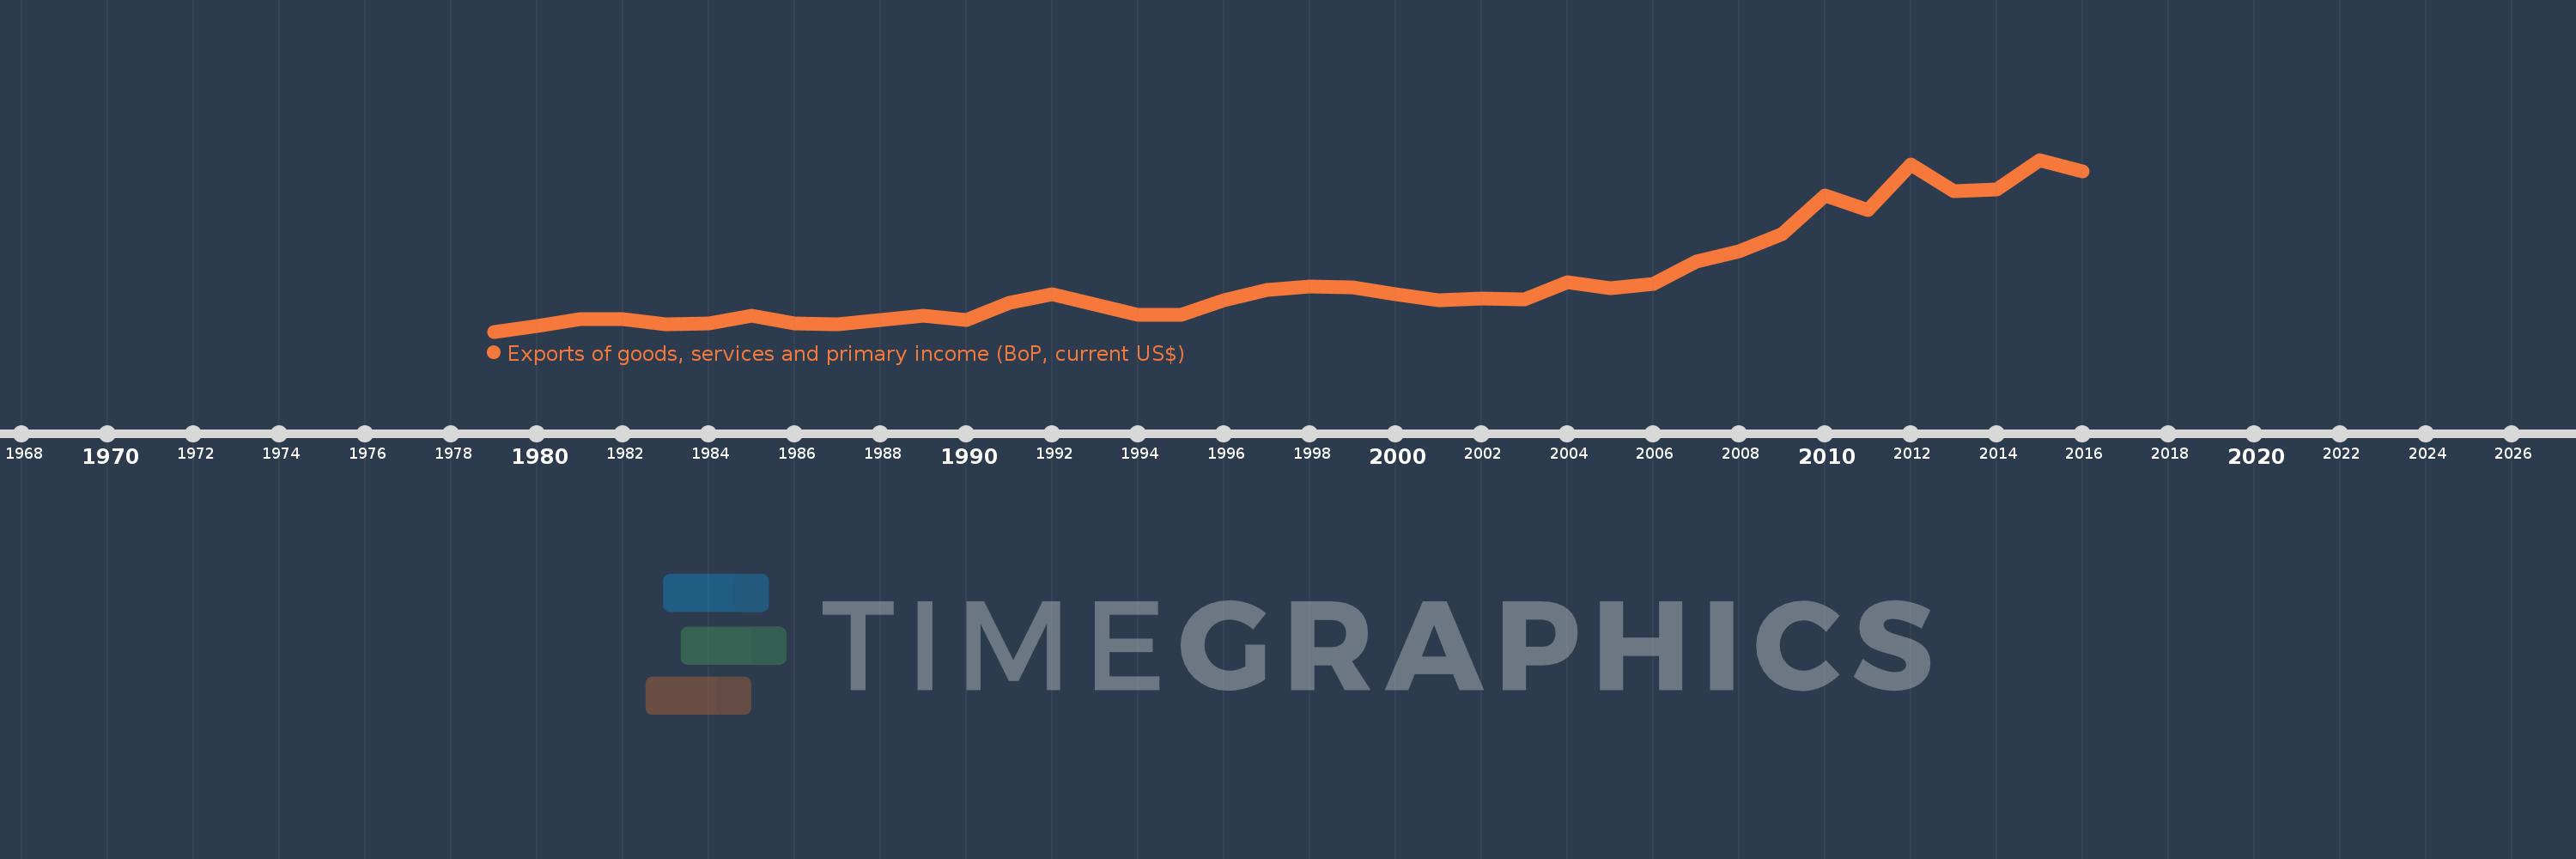
Exports of goods, services and primary income (BoP, current US$)
2016,2015,2014,2013,2012,2011,2010,2009,2008,2007,2006,2005,2004,2003,2002,2001,2000,1999,1998,1997,1996,1995,1994,1993,1992,1991,1990,1989,1988,1987,1986,1985,1984,1983,1982,1981,1980,1979
Cette statistique dans les autres pays:
AfghanistanAlbaniaAlgeriaAngolaAntigua and BarbudaArab WorldArgentinaArmeniaArubaAustraliaAustriaAzerbaijanBahamas, TheBahrainBangladeshBarbadosBelarusBelgiumBelizeBeninBermudaBhutanBoliviaBosnia and HerzegovinaBotswanaBrazilBrunei DarussalamBulgariaBurkina FasoBurundiCabo VerdeCambodiaCameroonCanadaCaribbean small statesCentral African RepublicCentral Europe and the BalticsChadChileChinaColombiaComorosCongo, Dem. Rep.Congo, Rep.Costa RicaCote d'IvoireCroatiaCuracaoCyprusCzech RepublicDenmarkDjiboutiDominicaDominican RepublicEarly-demographic dividendEast Asia & PacificEast Asia & Pacific (excluding high income)East Asia & Pacific (IDA & IBRD countries)EcuadorEgypt, Arab Rep.El SalvadorEquatorial GuineaEritreaEstoniaEthiopiaEuro areaEurope & Central AsiaEurope & Central Asia (excluding high income)Europe & Central Asia (IDA & IBRD countries)European UnionFaroe IslandsFijiFinlandFragile and conflict affected situationsFranceFrench PolynesiaGabonGambia, TheGeorgiaGermanyGhanaGreeceGrenadaGuatemalaGuineaGuinea-BissauGuyanaHaitiHeavily indebted poor countries (HIPC)High incomeHondurasHong Kong SAR, ChinaHungaryIBRD onlyIcelandIDA & IBRD totalIDA blendIDA onlyIDA totalIndiaIndonesiaIran, Islamic Rep.IraqIrelandIsraelItalyJamaicaJapanJordanKazakhstanKenyaKiribatiKorea, Rep.KosovoKuwaitKyrgyz RepublicLao PDRLate-demographic dividendLatin America & Caribbean Latin America & Caribbean (excluding high income)Latin America & the Caribbean (IDA & IBRD countries)LatviaLeast developed countries: UN classificationLebanonLesothoLiberiaLibyaLithuaniaLow & middle incomeLow incomeLower middle incomeLuxembourgMacao SAR, ChinaMacedonia, FYRMadagascarMalawiMalaysiaMaldivesMaliMaltaMarshall IslandsMauritaniaMauritiusMexicoMicronesia, Fed. Sts.Middle East & North Africa (excluding high income)Middle East & North Africa (IDA & IBRD countries)Middle incomeMoldovaMongoliaMontenegroMoroccoMozambiqueMyanmarNamibiaNepalNetherlandsNew CaledoniaNicaraguaNigerNigeriaNorth AmericaNorwayOECD membersOmanPacific island small statesPakistanPalauPanamaPapua New GuineaParaguayPeruPhilippinesPolandPortugalPost-demographic dividendPre-demographic dividendQatarRomaniaRussian FederationRwandaSamoaSao Tome and PrincipeSaudi ArabiaSenegalSerbiaSeychellesSierra LeoneSingaporeSint Maarten (Dutch part)Slovak RepublicSloveniaSolomon IslandsSouth AfricaSouth AsiaSouth Asia (IDA & IBRD)South SudanSpainSri LankaSt. Kitts and NevisSt. LuciaSt. Vincent and the GrenadinesSub-Saharan Africa Sub-Saharan Africa (excluding high income)Sub-Saharan Africa (IDA & IBRD countries)SudanSurinameSwazilandSwedenSwitzerlandSyrian Arab RepublicTajikistanTanzaniaThailandTimor-LesteTogoTongaTrinidad and TobagoTunisiaTurkeyTuvaluUgandaUkraineUnited KingdomUnited StatesUpper middle incomeUruguayVanuatuVenezuela, RBVietnamWest Bank and GazaWorldYemen, Rep.ZambiaZimbabwe La ligne de temps
Cette échelle de temps montre un graphique de 1979 année à 2016 année Malawi. Les données jusqu'à 1978 année ne sont pas présentés. Quantité d'observations actuelles selon dates: 38.
Source (désignation):
Les indicateurs du développement mondiale
Source (organisation):
International Monetary Fund, Balance of Payments Statistics Yearbook and data files.
Catégories:
Economy & Growth, External Debt, Trade
Dernière mise à jour
23 avr. 2017
Les indicateurs de changement de valeurs selon les années
Minimum:
211.201 mln.
1 janv. 1979
Maximum:
1.645 mds
1 janv. 2015
Pour la date d''observation
Valeur
Changement absolu
Le changement par rapport à la valeur précédente
1 janv. 1979
211.201 mln.
+211.201 mln.
0.0%
1 janv. 1980
258.545 mln.
+47.344 mln.
22.42%
1 janv. 1981
314.741 mln.
+56.196 mln.
21.74%
1 janv. 1982
317.548 mln.
+2.806 mln.
0.89%
1 janv. 1983
269.064 mln.
-48.483 mln.
-15.27%
1 janv. 1984
276.056 mln.
+6.991 mln.
2.6%
1 janv. 1985
341.451 mln.
+65.395 mln.
23.69%
1 janv. 1986
276.133 mln.
-65.318 mln.
-19.13%
1 janv. 1987
271.832 mln.
-4.301 mln.
-1.56%
1 janv. 1988
309.226 mln.
+37.393 mln.
13.76%
1 janv. 1989
341.545 mln.
+32.319 mln.
10.45%
1 janv. 1990
309.836 mln.
-31.709 mln.
-9.28%
1 janv. 1991
452.42 mln.
+142.584 mln.
46.02%
1 janv. 1992
521.419 mln.
+68.999 mln.
15.25%
1 janv. 1993
434.716 mln.
-86.703 mln.
-16.63%
1 janv. 1994
349.597 mln.
-85.118 mln.
-19.58%
1 janv. 1995
353.99 mln.
+4.393 mln.
1.26%
1 janv. 1996
473.281 mln.
+119.291 mln.
33.7%
1 janv. 1997
555.784 mln.
+82.503 mln.
17.43%
1 janv. 1998
591.22 mln.
+35.436 mln.
6.38%
1 janv. 1999
582.589 mln.
-8.632 mln.
-1.46%
1 janv. 2000
523.211 mln.
-59.378 mln.
-10.19%
1 janv. 2001
470.671 mln.
-52.54 mln.
-10.04%
1 janv. 2002
483.731 mln.
+13.059 mln.
2.77%
1 janv. 2003
477.888 mln.
-5.842 mln.
-1.21%
1 janv. 2004
622.15 mln.
+144.262 mln.
30.19%
1 janv. 2005
573.76 mln.
-48.39 mln.
-7.78%
1 janv. 2006
609.273 mln.
+35.513 mln.
6.19%
1 janv. 2007
792.731 mln.
+183.458 mln.
30.11%
1 janv. 2008
878.834 mln.
+86.103 mln.
10.86%
1 janv. 2009
1.026 mds
+147.36 mln.
16.77%
1 janv. 2010
1.348 mds
+321.629 mln.
31.34%
1 janv. 2011
1.224 mds
-123.417 mln.
-9.16%
1 janv. 2012
1.606 mds
+381.63 mln.
31.17%
1 janv. 2013
1.385 mds
-221.257 mln.
-13.78%
1 janv. 2014
1.398 mds
+12.811 mln.
0.93%
1 janv. 2015
1.645 mds
+247.896 mln.
17.74%
1 janv. 2016
1.548 mds
-97.308 mln.
-5.91%
Classement des pays selon les statistiques actuelles par années


Commentaires: