29
/es/
es
AIzaSyAYiBZKx7MnpbEhh9jyipgxe19OcubqV5w
April 1, 2024
98086
Cabo Verde
CPV
true
2
1
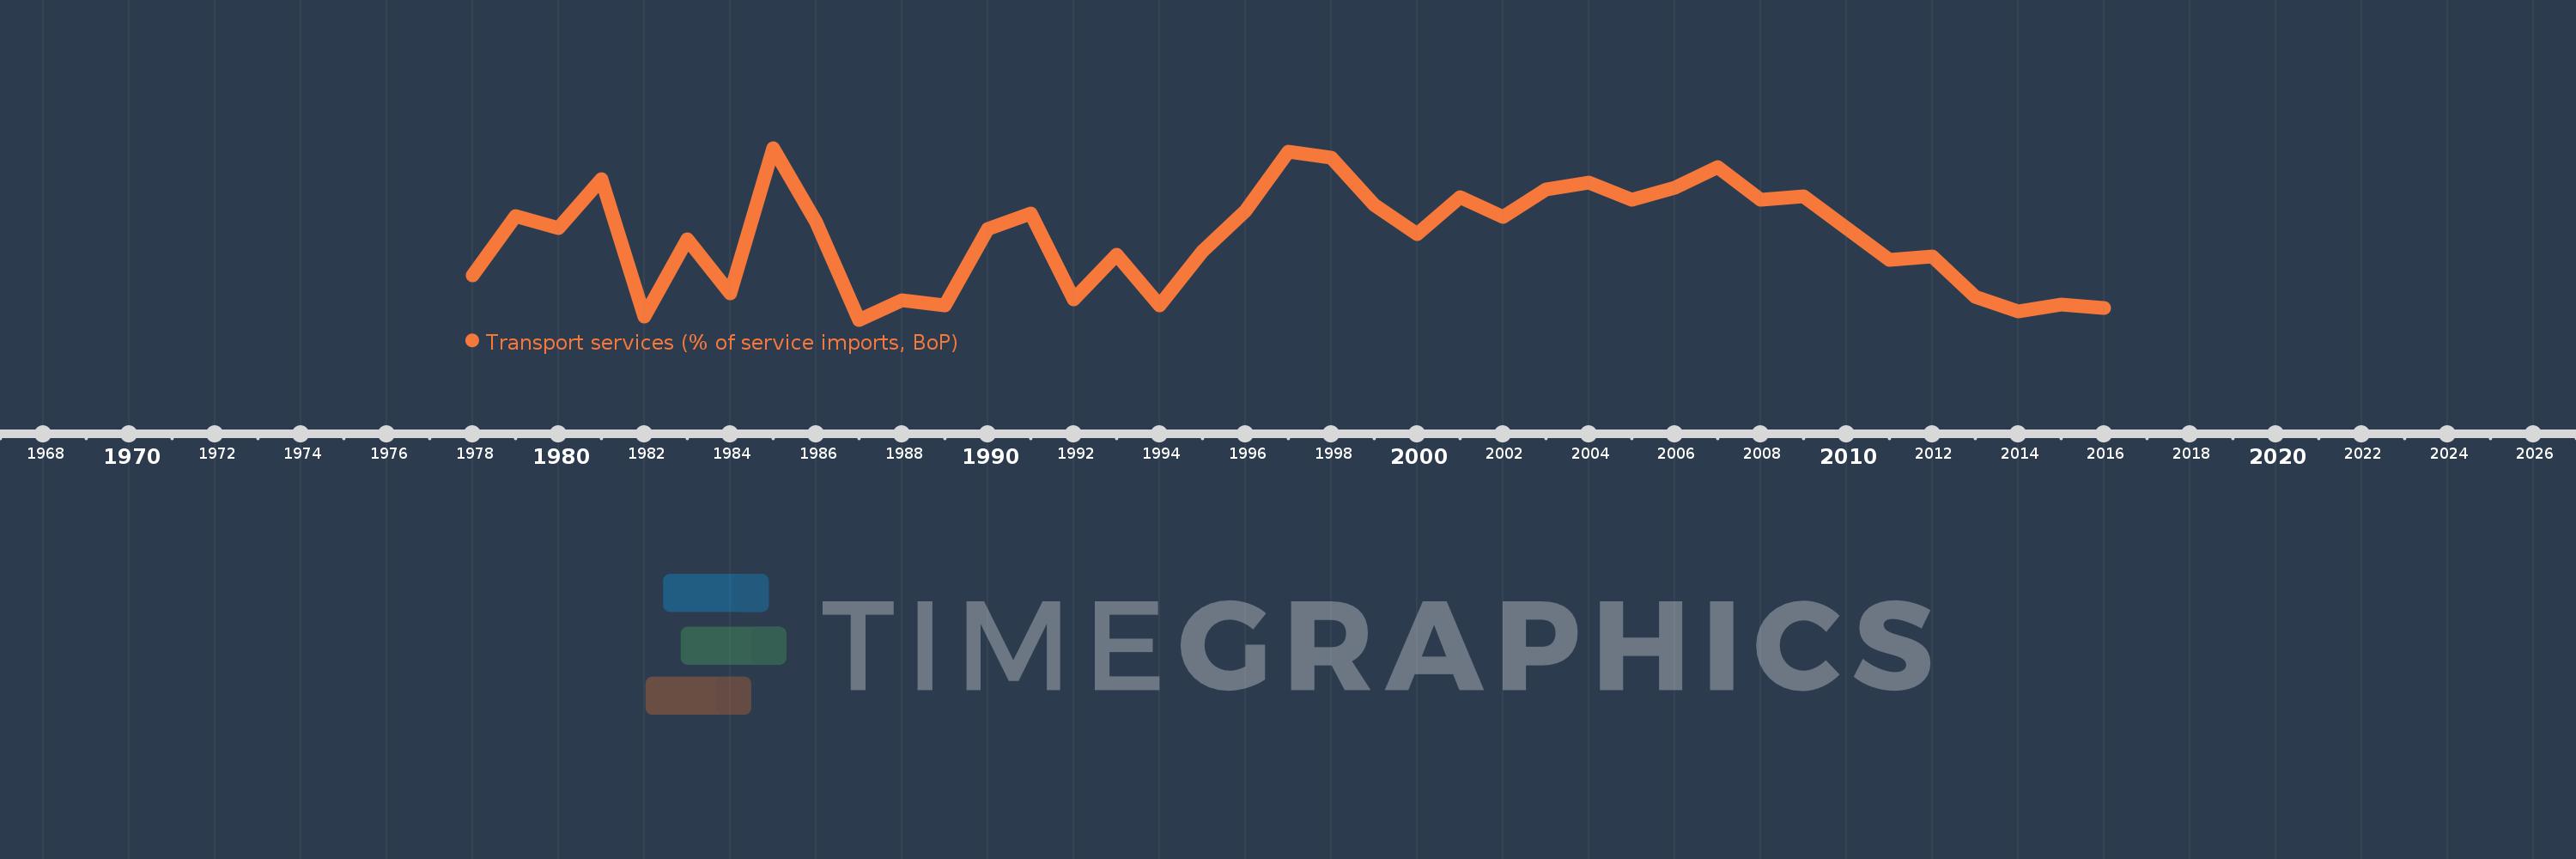
Transport services (% of service imports, BoP)
2016,2015,2014,2013,2012,2011,2010,2009,2008,2007,2006,2005,2004,2003,2002,2001,2000,1999,1998,1997,1996,1995,1994,1993,1992,1991,1990,1989,1988,1987,1986,1985,1984,1983,1982,1981,1980,1979,1978
Estas estadísticas en otros países:
AfghanistanAlbaniaAlgeriaAngolaAntigua and BarbudaArab WorldArgentinaArmeniaArubaAustraliaAustriaAzerbaijanBahamas, TheBahrainBangladeshBarbadosBelarusBelgiumBelizeBeninBermudaBhutanBoliviaBosnia and HerzegovinaBotswanaBrazilBrunei DarussalamBulgariaBurkina FasoBurundiCabo VerdeCambodiaCameroonCanadaCaribbean small statesCentral African RepublicCentral Europe and the BalticsChadChileChinaColombiaComorosCongo, Dem. Rep.Congo, Rep.Costa RicaCote d'IvoireCroatiaCuracaoCyprusCzech RepublicDenmarkDjiboutiDominicaDominican RepublicEarly-demographic dividendEast Asia & PacificEast Asia & Pacific (excluding high income)East Asia & Pacific (IDA & IBRD countries)EcuadorEgypt, Arab Rep.El SalvadorEquatorial GuineaEritreaEstoniaEthiopiaEuro areaEurope & Central AsiaEurope & Central Asia (excluding high income)Europe & Central Asia (IDA & IBRD countries)European UnionFaroe IslandsFijiFinlandFragile and conflict affected situationsFranceFrench PolynesiaGabonGambia, TheGeorgiaGermanyGhanaGreeceGrenadaGuatemalaGuineaGuinea-BissauGuyanaHaitiHeavily indebted poor countries (HIPC)High incomeHondurasHong Kong SAR, ChinaHungaryIBRD onlyIcelandIDA & IBRD totalIDA onlyIDA totalIndiaIndonesiaIran, Islamic Rep.IraqIrelandIsraelItalyJamaicaJapanJordanKazakhstanKenyaKiribatiKorea, Rep.KosovoKuwaitKyrgyz RepublicLao PDRLate-demographic dividendLatin America & Caribbean Latin America & Caribbean (excluding high income)Latin America & the Caribbean (IDA & IBRD countries)LatviaLeast developed countries: UN classificationLebanonLesothoLiberiaLibyaLithuaniaLow & middle incomeLow incomeLower middle incomeLuxembourgMacao SAR, ChinaMacedonia, FYRMadagascarMalawiMalaysiaMaldivesMaliMaltaMarshall IslandsMauritaniaMauritiusMexicoMicronesia, Fed. Sts.Middle East & North AfricaMiddle East & North Africa (excluding high income)Middle East & North Africa (IDA & IBRD countries)Middle incomeMoldovaMongoliaMontenegroMoroccoMozambiqueMyanmarNamibiaNepalNetherlandsNew CaledoniaNew ZealandNicaraguaNigerNigeriaNorth AmericaNorwayOECD membersOmanOther small statesPacific island small statesPakistanPalauPanamaPapua New GuineaParaguayPeruPhilippinesPolandPortugalPost-demographic dividendPre-demographic dividendQatarRomaniaRussian FederationRwandaSamoaSao Tome and PrincipeSaudi ArabiaSenegalSerbiaSeychellesSierra LeoneSingaporeSint Maarten (Dutch part)Slovak RepublicSloveniaSmall statesSolomon IslandsSouth AfricaSouth AsiaSouth Asia (IDA & IBRD)South SudanSpainSri LankaSt. Kitts and NevisSt. LuciaSt. Vincent and the GrenadinesSub-Saharan Africa Sub-Saharan Africa (excluding high income)Sub-Saharan Africa (IDA & IBRD countries)SudanSurinameSwazilandSwedenSwitzerlandSyrian Arab RepublicTajikistanTanzaniaThailandTimor-LesteTogoTongaTrinidad and TobagoTunisiaTurkeyTuvaluUgandaUkraineUnited KingdomUnited StatesUpper middle incomeUruguayVanuatuVenezuela, RBWest Bank and GazaWorldYemen, Rep.ZambiaZimbabwe línea de tiempo (timeline):
En esta escala de tiempo se presenta un gráfico de 1978 y 2016 de Cabo Verde. Los datos de 1977 están ausentes. El número de observaciones reales por fecha: 39.
Fuente (nombre):
Indicadores del desarrollo mundial
Fuente (organización):
International Monetary Fund, Balance of Payments Statistics Yearbook and data files.
Categorías:
Economy & Growth, Trade
Se ha actualizado:
23 abr 2017 año
Los indicadores de los cambios de valor en los últimos años
Mínimo:
22.995
1 ene 1987 año
Máximo:
52.361
1 ene 1985 año
A la fecha de observación
Valor
Cambio absoluto
El cambio con respecto al valor anterior
1 ene 1978 año
30.61
+30.61
0.0%
1 ene 1979 año
40.701
+10.091
32.97%
1 ene 1980 año
38.708
-1.993
-4.9%
1 ene 1981 año
47.031
+8.323
21.5%
1 ene 1982 año
23.498
-23.533
-50.04%
1 ene 1983 año
36.754
+13.256
56.41%
1 ene 1984 año
27.501
-9.253
-25.17%
1 ene 1985 año
52.361
+24.86
90.4%
1 ene 1986 año
39.674
-12.688
-24.23%
1 ene 1987 año
22.995
-16.679
-42.04%
1 ene 1988 año
26.29
+3.295
14.33%
1 ene 1989 año
25.384
-0.906
-3.45%
1 ene 1990 año
38.578
+13.195
51.98%
1 ene 1991 año
41.165
+2.586
6.7%
1 ene 1992 año
26.52
-14.645
-35.58%
1 ene 1993 año
34.14
+7.62
28.73%
1 ene 1994 año
25.398
-8.742
-25.61%
1 ene 1995 año
34.643
+9.245
36.4%
1 ene 1996 año
41.655
+7.012
20.24%
1 ene 1997 año
51.784
+10.129
24.32%
1 ene 1998 año
50.714
-1.07
-2.07%
1 ene 1999 año
42.617
-8.097
-15.97%
1 ene 2000 año
37.64
-4.977
-11.68%
1 ene 2001 año
44.018
+6.378
16.95%
1 ene 2002 año
40.559
-3.46
-7.86%
1 ene 2003 año
45.213
+4.654
11.47%
1 ene 2004 año
46.456
+1.243
2.75%
1 ene 2005 año
43.524
-2.932
-6.31%
1 ene 2006 año
45.636
+2.113
4.85%
1 ene 2007 año
49.118
+3.482
7.63%
1 ene 2008 año
43.555
-5.563
-11.33%
1 ene 2009 año
44.026
+0.471
1.08%
1 ene 2010 año
38.728
-5.298
-12.03%
1 ene 2011 año
33.164
-5.564
-14.37%
1 ene 2012 año
33.857
+0.692
2.09%
1 ene 2013 año
26.879
-6.978
-20.61%
1 ene 2014 año
24.351
-2.528
-9.41%
1 ene 2015 año
25.534
+1.184
4.86%
1 ene 2016 año
24.978
-0.556
-2.18%
Ranking de los países por los datos estadísticos actuales


Comentarios: