29
/es/
es
AIzaSyAYiBZKx7MnpbEhh9jyipgxe19OcubqV5w
April 1, 2024
149842
Haiti
HTI
true
2
1
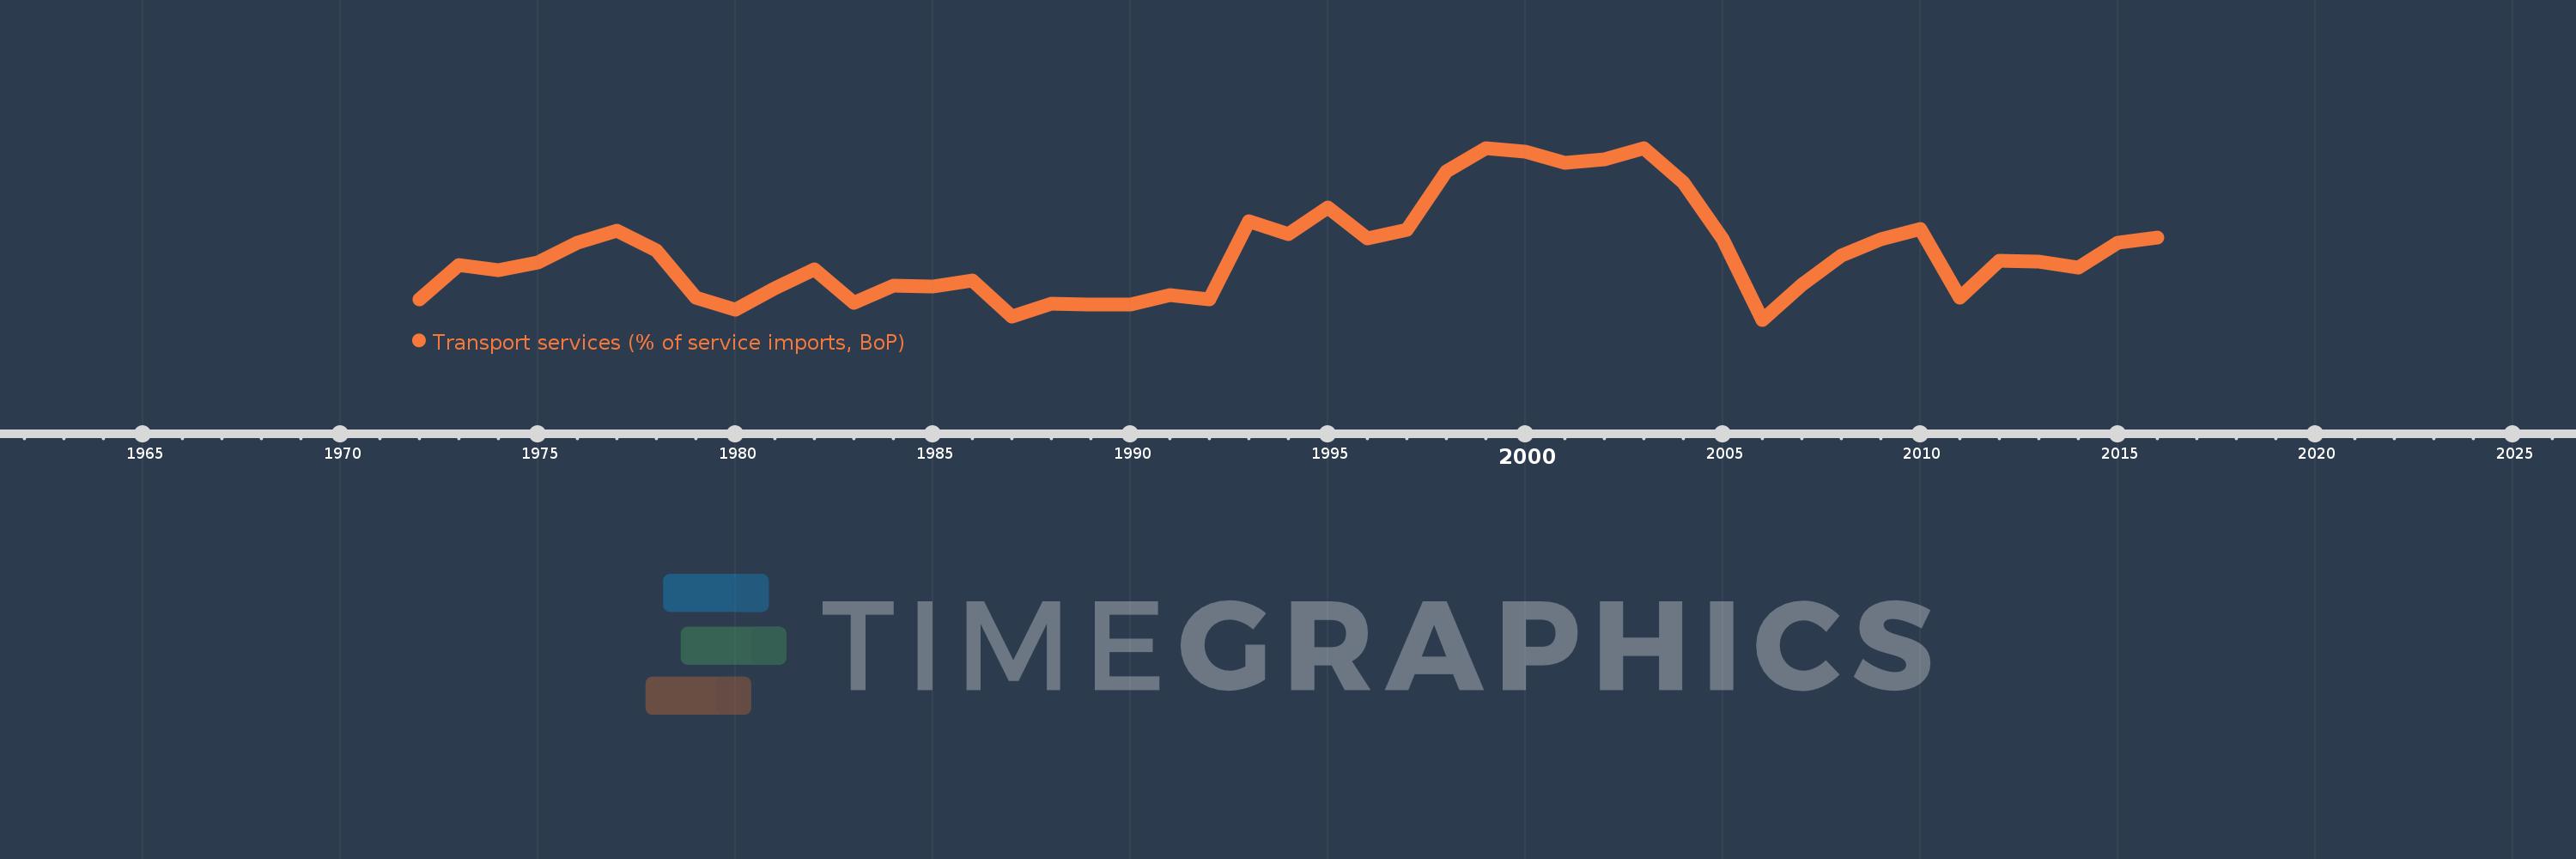
Transport services (% of service imports, BoP)
2016,2015,2014,2013,2012,2011,2010,2009,2008,2007,2006,2005,2004,2003,2002,2001,2000,1999,1998,1997,1996,1995,1994,1993,1992,1991,1990,1989,1988,1987,1986,1985,1984,1983,1982,1981,1980,1979,1978,1977,1976,1975,1974,1973,1972
Estas estadísticas en otros países:
AfghanistanAlbaniaAlgeriaAngolaAntigua and BarbudaArab WorldArgentinaArmeniaArubaAustraliaAustriaAzerbaijanBahamas, TheBahrainBangladeshBarbadosBelarusBelgiumBelizeBeninBermudaBhutanBoliviaBosnia and HerzegovinaBotswanaBrazilBrunei DarussalamBulgariaBurkina FasoBurundiCabo VerdeCambodiaCameroonCanadaCaribbean small statesCentral African RepublicCentral Europe and the BalticsChadChileChinaColombiaComorosCongo, Dem. Rep.Congo, Rep.Costa RicaCote d'IvoireCroatiaCuracaoCyprusCzech RepublicDenmarkDjiboutiDominicaDominican RepublicEarly-demographic dividendEast Asia & PacificEast Asia & Pacific (excluding high income)East Asia & Pacific (IDA & IBRD countries)EcuadorEgypt, Arab Rep.El SalvadorEquatorial GuineaEritreaEstoniaEthiopiaEuro areaEurope & Central AsiaEurope & Central Asia (excluding high income)Europe & Central Asia (IDA & IBRD countries)European UnionFaroe IslandsFijiFinlandFragile and conflict affected situationsFranceFrench PolynesiaGabonGambia, TheGeorgiaGermanyGhanaGreeceGrenadaGuatemalaGuineaGuinea-BissauGuyanaHaitiHeavily indebted poor countries (HIPC)High incomeHondurasHong Kong SAR, ChinaHungaryIBRD onlyIcelandIDA & IBRD totalIDA onlyIDA totalIndiaIndonesiaIran, Islamic Rep.IraqIrelandIsraelItalyJamaicaJapanJordanKazakhstanKenyaKiribatiKorea, Rep.KosovoKuwaitKyrgyz RepublicLao PDRLate-demographic dividendLatin America & Caribbean Latin America & Caribbean (excluding high income)Latin America & the Caribbean (IDA & IBRD countries)LatviaLeast developed countries: UN classificationLebanonLesothoLiberiaLibyaLithuaniaLow & middle incomeLow incomeLower middle incomeLuxembourgMacao SAR, ChinaMacedonia, FYRMadagascarMalawiMalaysiaMaldivesMaliMaltaMarshall IslandsMauritaniaMauritiusMexicoMicronesia, Fed. Sts.Middle East & North AfricaMiddle East & North Africa (excluding high income)Middle East & North Africa (IDA & IBRD countries)Middle incomeMoldovaMongoliaMontenegroMoroccoMozambiqueMyanmarNamibiaNepalNetherlandsNew CaledoniaNew ZealandNicaraguaNigerNigeriaNorth AmericaNorwayOECD membersOmanOther small statesPacific island small statesPakistanPalauPanamaPapua New GuineaParaguayPeruPhilippinesPolandPortugalPost-demographic dividendPre-demographic dividendQatarRomaniaRussian FederationRwandaSamoaSao Tome and PrincipeSaudi ArabiaSenegalSerbiaSeychellesSierra LeoneSingaporeSint Maarten (Dutch part)Slovak RepublicSloveniaSmall statesSolomon IslandsSouth AfricaSouth AsiaSouth Asia (IDA & IBRD)South SudanSpainSri LankaSt. Kitts and NevisSt. LuciaSt. Vincent and the GrenadinesSub-Saharan Africa Sub-Saharan Africa (excluding high income)Sub-Saharan Africa (IDA & IBRD countries)SudanSurinameSwazilandSwedenSwitzerlandSyrian Arab RepublicTajikistanTanzaniaThailandTimor-LesteTogoTongaTrinidad and TobagoTunisiaTurkeyTuvaluUgandaUkraineUnited KingdomUnited StatesUpper middle incomeUruguayVanuatuVenezuela, RBWest Bank and GazaWorldYemen, Rep.ZambiaZimbabwe línea de tiempo (timeline):
En esta escala de tiempo se presenta un gráfico de 1972 y 2016 de Haiti. Los datos de 1971 están ausentes. El número de observaciones reales por fecha: 45.
Fuente (nombre):
Indicadores del desarrollo mundial
Fuente (organización):
International Monetary Fund, Balance of Payments Statistics Yearbook and data files.
Categorías:
Economy & Growth, Trade
Se ha actualizado:
23 abr 2017 año
Los indicadores de los cambios de valor en los últimos años
Mínimo:
39.925
1 ene 2006 año
Máximo:
91.303
1 ene 1999 año
A la fecha de observación
Valor
Cambio absoluto
El cambio con respecto al valor anterior
1 ene 1972 año
46.09
+46.09
0.0%
1 ene 1973 año
56.205
+10.115
21.95%
1 ene 1974 año
54.651
-1.554
-2.76%
1 ene 1975 año
57.143
+2.492
4.56%
1 ene 1976 año
62.915
+5.772
10.1%
1 ene 1977 año
66.692
+3.777
6.0%
1 ene 1978 año
60.615
-6.077
-9.11%
1 ene 1979 año
46.487
-14.128
-23.31%
1 ene 1980 año
42.9
-3.587
-7.72%
1 ene 1981 año
49.259
+6.36
14.82%
1 ene 1982 año
54.941
+5.681
11.53%
1 ene 1983 año
45.111
-9.83
-17.89%
1 ene 1984 año
50.058
+4.948
10.97%
1 ene 1985 año
49.825
-0.233
-0.47%
1 ene 1986 año
51.634
+1.808
3.63%
1 ene 1987 año
40.942
-10.692
-20.71%
1 ene 1988 año
44.835
+3.893
9.51%
1 ene 1989 año
44.399
-0.436
-0.97%
1 ene 1990 año
44.599
+0.199
0.45%
1 ene 1991 año
47.222
+2.624
5.88%
1 ene 1992 año
46.098
-1.124
-2.38%
1 ene 1993 año
69.318
+23.22
50.37%
1 ene 1994 año
65.563
-3.755
-5.42%
1 ene 1995 año
73.552
+7.99
12.19%
1 ene 1996 año
64.321
-9.231
-12.55%
1 ene 1997 año
66.816
+2.495
3.88%
1 ene 1998 año
84.344
+17.528
26.23%
1 ene 1999 año
91.303
+6.959
8.25%
1 ene 2000 año
90.195
-1.108
-1.21%
1 ene 2001 año
86.879
-3.316
-3.68%
1 ene 2002 año
87.906
+1.026
1.18%
1 ene 2003 año
91.303
+3.397
3.86%
1 ene 2004 año
80.911
-10.391
-11.38%
1 ene 2005 año
63.971
-16.94
-20.94%
1 ene 2006 año
39.925
-24.046
-37.59%
1 ene 2007 año
50.492
+10.567
26.47%
1 ene 2008 año
59.228
+8.736
17.3%
1 ene 2009 año
64.066
+4.838
8.17%
1 ene 2010 año
66.965
+2.899
4.52%
1 ene 2011 año
46.58
-20.385
-30.44%
1 ene 2012 año
57.688
+11.108
23.85%
1 ene 2013 año
57.408
-0.281
-0.49%
1 ene 2014 año
55.638
-1.77
-3.08%
1 ene 2015 año
63.024
+7.386
13.27%
1 ene 2016 año
64.531
+1.508
2.39%
Ranking de los países por los datos estadísticos actuales


Comentarios: