29
/es/
es
AIzaSyAYiBZKx7MnpbEhh9jyipgxe19OcubqV5w
April 1, 2024
196394
Mexico
MEX
true
2
1
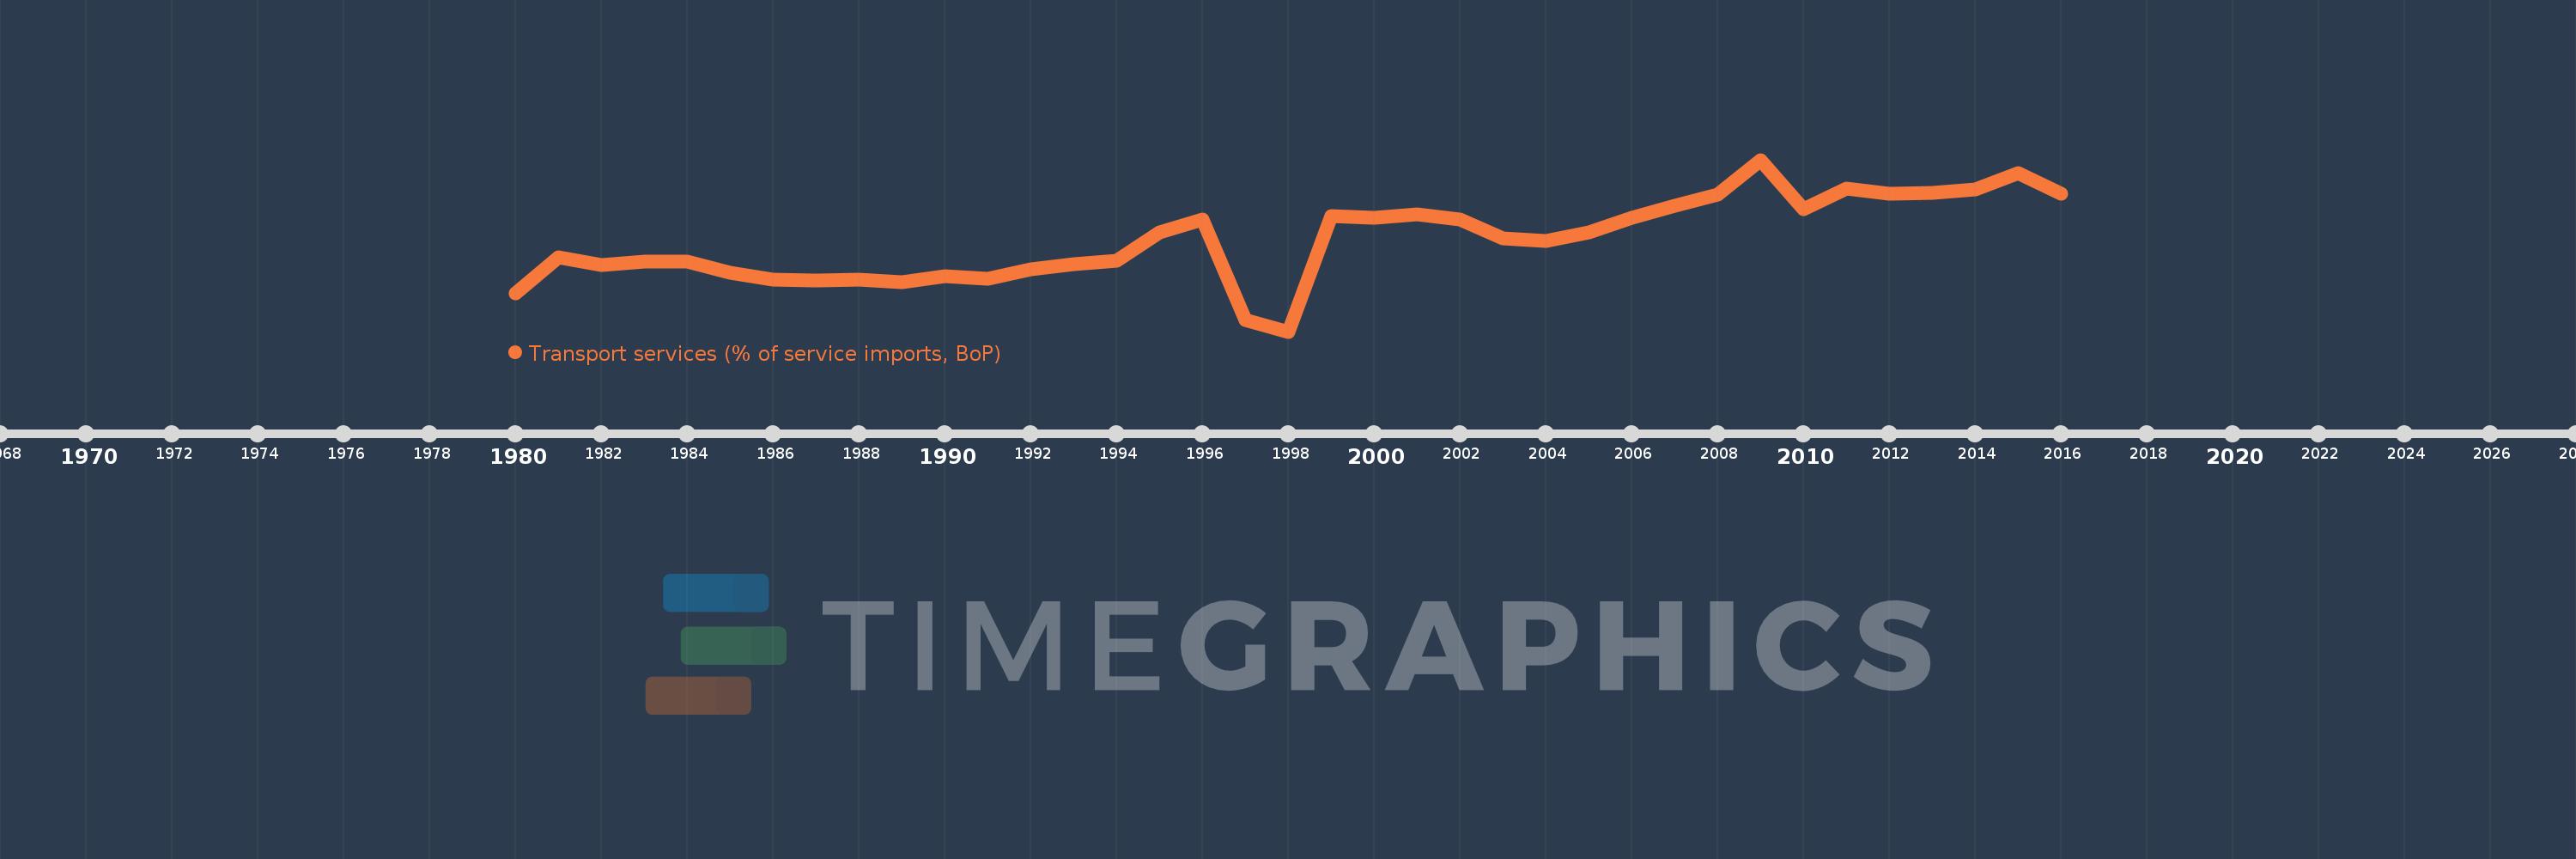
Transport services (% of service imports, BoP)
2016,2015,2014,2013,2012,2011,2010,2009,2008,2007,2006,2005,2004,2003,2002,2001,2000,1999,1998,1997,1996,1995,1994,1993,1992,1991,1990,1989,1988,1987,1986,1985,1984,1983,1982,1981,1980
Estas estadísticas en otros países:
AfghanistanAlbaniaAlgeriaAngolaAntigua and BarbudaArab WorldArgentinaArmeniaArubaAustraliaAustriaAzerbaijanBahamas, TheBahrainBangladeshBarbadosBelarusBelgiumBelizeBeninBermudaBhutanBoliviaBosnia and HerzegovinaBotswanaBrazilBrunei DarussalamBulgariaBurkina FasoBurundiCabo VerdeCambodiaCameroonCanadaCaribbean small statesCentral African RepublicCentral Europe and the BalticsChadChileChinaColombiaComorosCongo, Dem. Rep.Congo, Rep.Costa RicaCote d'IvoireCroatiaCuracaoCyprusCzech RepublicDenmarkDjiboutiDominicaDominican RepublicEarly-demographic dividendEast Asia & PacificEast Asia & Pacific (excluding high income)East Asia & Pacific (IDA & IBRD countries)EcuadorEgypt, Arab Rep.El SalvadorEquatorial GuineaEritreaEstoniaEthiopiaEuro areaEurope & Central AsiaEurope & Central Asia (excluding high income)Europe & Central Asia (IDA & IBRD countries)European UnionFaroe IslandsFijiFinlandFragile and conflict affected situationsFranceFrench PolynesiaGabonGambia, TheGeorgiaGermanyGhanaGreeceGrenadaGuatemalaGuineaGuinea-BissauGuyanaHaitiHeavily indebted poor countries (HIPC)High incomeHondurasHong Kong SAR, ChinaHungaryIBRD onlyIcelandIDA & IBRD totalIDA onlyIDA totalIndiaIndonesiaIran, Islamic Rep.IraqIrelandIsraelItalyJamaicaJapanJordanKazakhstanKenyaKiribatiKorea, Rep.KosovoKuwaitKyrgyz RepublicLao PDRLate-demographic dividendLatin America & Caribbean Latin America & Caribbean (excluding high income)Latin America & the Caribbean (IDA & IBRD countries)LatviaLeast developed countries: UN classificationLebanonLesothoLiberiaLibyaLithuaniaLow & middle incomeLow incomeLower middle incomeLuxembourgMacao SAR, ChinaMacedonia, FYRMadagascarMalawiMalaysiaMaldivesMaliMaltaMarshall IslandsMauritaniaMauritiusMexicoMicronesia, Fed. Sts.Middle East & North AfricaMiddle East & North Africa (excluding high income)Middle East & North Africa (IDA & IBRD countries)Middle incomeMoldovaMongoliaMontenegroMoroccoMozambiqueMyanmarNamibiaNepalNetherlandsNew CaledoniaNew ZealandNicaraguaNigerNigeriaNorth AmericaNorwayOECD membersOmanOther small statesPacific island small statesPakistanPalauPanamaPapua New GuineaParaguayPeruPhilippinesPolandPortugalPost-demographic dividendPre-demographic dividendQatarRomaniaRussian FederationRwandaSamoaSao Tome and PrincipeSaudi ArabiaSenegalSerbiaSeychellesSierra LeoneSingaporeSint Maarten (Dutch part)Slovak RepublicSloveniaSmall statesSolomon IslandsSouth AfricaSouth AsiaSouth Asia (IDA & IBRD)South SudanSpainSri LankaSt. Kitts and NevisSt. LuciaSt. Vincent and the GrenadinesSub-Saharan Africa Sub-Saharan Africa (excluding high income)Sub-Saharan Africa (IDA & IBRD countries)SudanSurinameSwazilandSwedenSwitzerlandSyrian Arab RepublicTajikistanTanzaniaThailandTimor-LesteTogoTongaTrinidad and TobagoTunisiaTurkeyTuvaluUgandaUkraineUnited KingdomUnited StatesUpper middle incomeUruguayVanuatuVenezuela, RBWest Bank and GazaWorldYemen, Rep.ZambiaZimbabwe línea de tiempo (timeline):
En esta escala de tiempo se presenta un gráfico de 1980 y 2016 de Mexico. Los datos de 1979 están ausentes. El número de observaciones reales por fecha: 37.
Fuente (nombre):
Indicadores del desarrollo mundial
Fuente (organización):
International Monetary Fund, Balance of Payments Statistics Yearbook and data files.
Categorías:
Economy & Growth, Trade
Se ha actualizado:
23 abr 2017 año
Los indicadores de los cambios de valor en los últimos años
Mínimo:
14.544
1 ene 1998 año
Máximo:
46.26
1 ene 2009 año
A la fecha de observación
Valor
Cambio absoluto
El cambio con respecto al valor anterior
1 ene 1980 año
21.63
+21.63
0.0%
1 ene 1981 año
28.184
+6.554
30.3%
1 ene 1982 año
26.788
-1.396
-4.95%
1 ene 1983 año
27.512
+0.725
2.71%
1 ene 1984 año
27.485
-0.027
-0.1%
1 ene 1985 año
25.475
-2.01
-7.31%
1 ene 1986 año
24.203
-1.271
-4.99%
1 ene 1987 año
24.055
-0.149
-0.61%
1 ene 1988 año
24.168
+0.113
0.47%
1 ene 1989 año
23.592
-0.576
-2.38%
1 ene 1990 año
24.836
+1.245
5.28%
1 ene 1991 año
24.323
-0.513
-2.07%
1 ene 1992 año
26.035
+1.712
7.04%
1 ene 1993 año
26.965
+0.929
3.57%
1 ene 1994 año
27.61
+0.645
2.39%
1 ene 1995 año
32.861
+5.251
19.02%
1 ene 1996 año
35.239
+2.378
7.24%
1 ene 1997 año
16.738
-18.5
-52.5%
1 ene 1998 año
14.544
-2.194
-13.11%
1 ene 1999 año
35.95
+21.405
147.17%
1 ene 2000 año
35.524
-0.426
-1.18%
1 ene 2001 año
36.268
+0.743
2.09%
1 ene 2002 año
35.217
-1.05
-2.9%
1 ene 2003 año
31.775
-3.443
-9.78%
1 ene 2004 año
31.22
-0.555
-1.75%
1 ene 2005 año
32.84
+1.619
5.19%
1 ene 2006 año
35.596
+2.757
8.39%
1 ene 2007 año
37.813
+2.217
6.23%
1 ene 2008 año
39.896
+2.083
5.51%
1 ene 2009 año
46.26
+6.364
15.95%
1 ene 2010 año
37.149
-9.111
-19.69%
1 ene 2011 año
40.977
+3.828
10.3%
1 ene 2012 año
39.965
-1.013
-2.47%
1 ene 2013 año
40.078
+0.113
0.28%
1 ene 2014 año
40.747
+0.669
1.67%
1 ene 2015 año
43.761
+3.015
7.4%
1 ene 2016 año
39.972
-3.789
-8.66%
Ranking de los países por los datos estadísticos actuales


Comentarios: