29
/es/
es
AIzaSyAYiBZKx7MnpbEhh9jyipgxe19OcubqV5w
April 1, 2024
180473
Libya
LBY
true
2
1
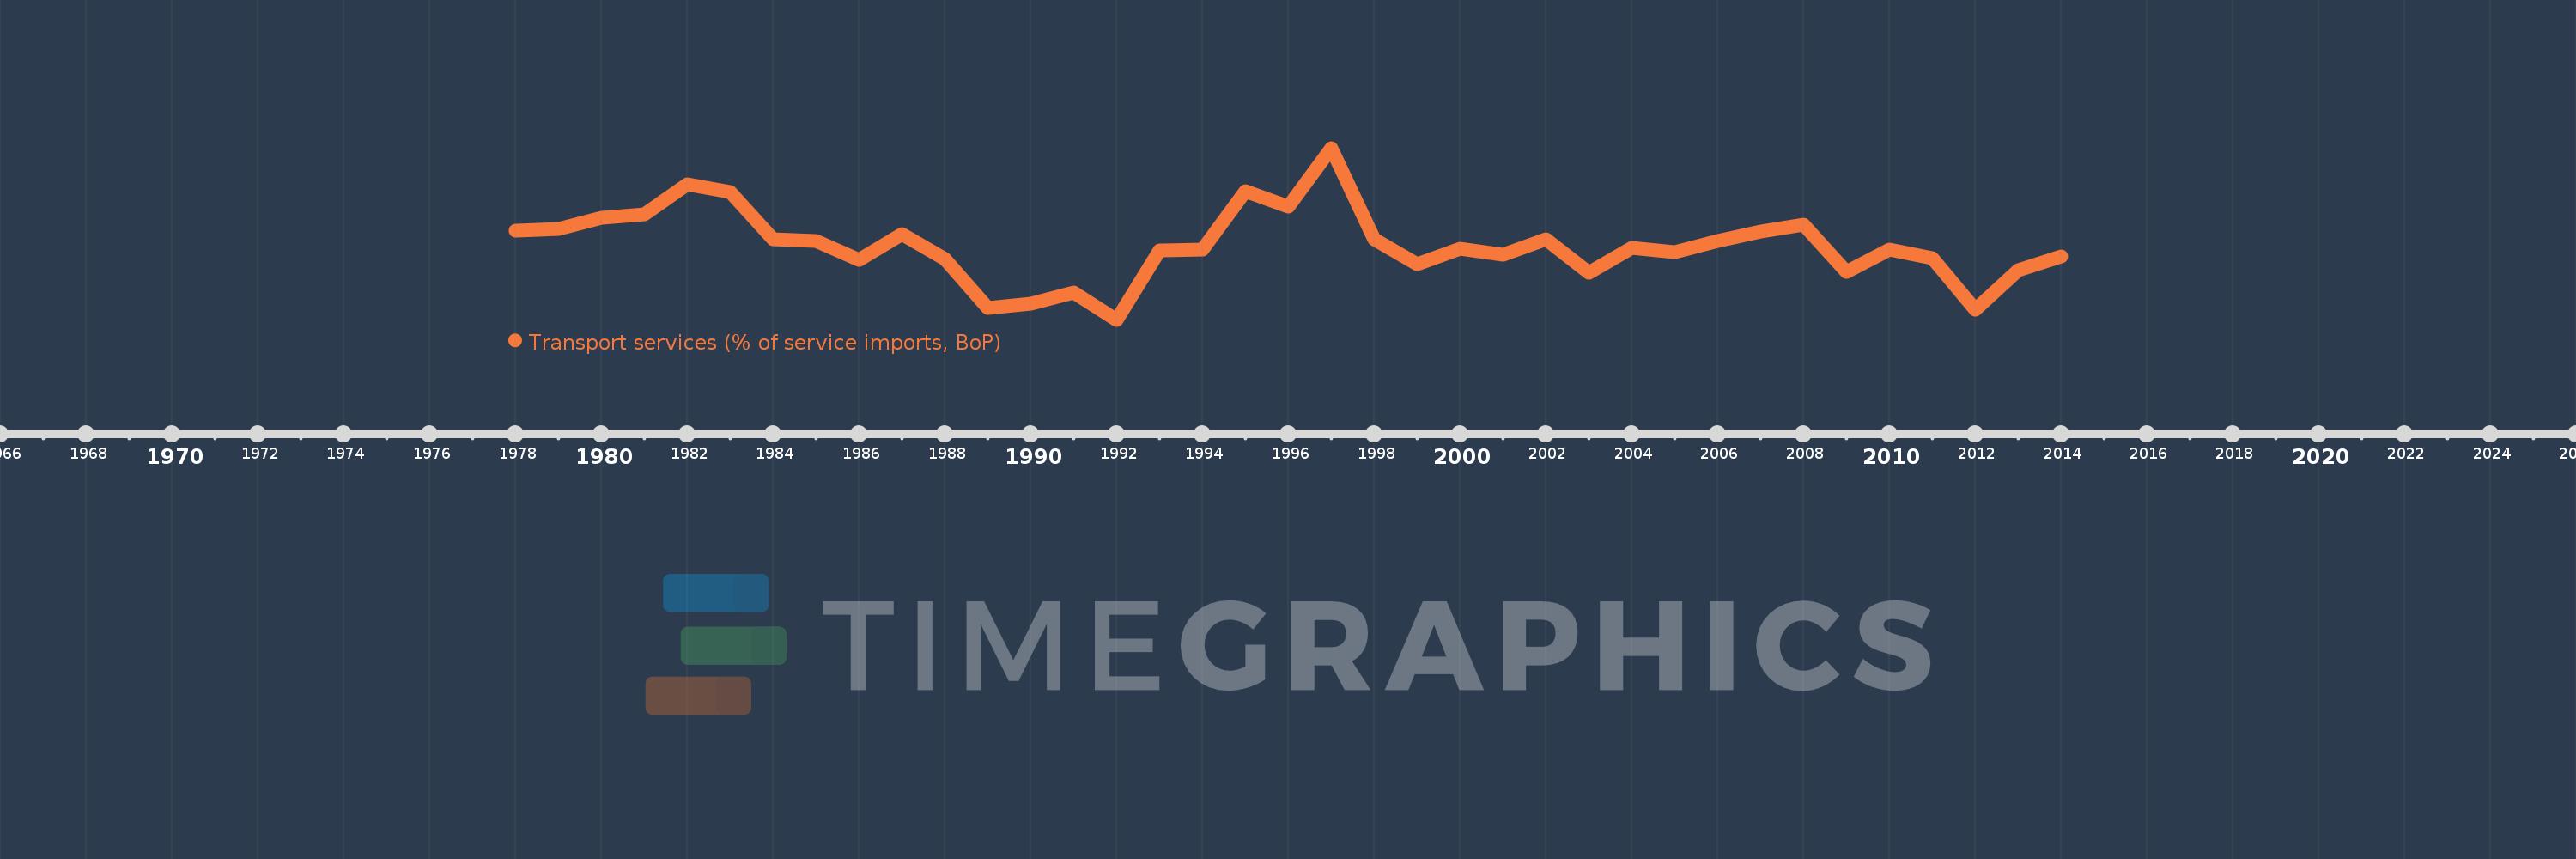
Transport services (% of service imports, BoP)
2014,2013,2012,2011,2010,2009,2008,2007,2006,2005,2004,2003,2002,2001,2000,1999,1998,1997,1996,1995,1994,1993,1992,1991,1990,1989,1988,1987,1986,1985,1984,1983,1982,1981,1980,1979,1978
Estas estadísticas en otros países:
AfghanistanAlbaniaAlgeriaAngolaAntigua and BarbudaArab WorldArgentinaArmeniaArubaAustraliaAustriaAzerbaijanBahamas, TheBahrainBangladeshBarbadosBelarusBelgiumBelizeBeninBermudaBhutanBoliviaBosnia and HerzegovinaBotswanaBrazilBrunei DarussalamBulgariaBurkina FasoBurundiCabo VerdeCambodiaCameroonCanadaCaribbean small statesCentral African RepublicCentral Europe and the BalticsChadChileChinaColombiaComorosCongo, Dem. Rep.Congo, Rep.Costa RicaCote d'IvoireCroatiaCuracaoCyprusCzech RepublicDenmarkDjiboutiDominicaDominican RepublicEarly-demographic dividendEast Asia & PacificEast Asia & Pacific (excluding high income)East Asia & Pacific (IDA & IBRD countries)EcuadorEgypt, Arab Rep.El SalvadorEquatorial GuineaEritreaEstoniaEthiopiaEuro areaEurope & Central AsiaEurope & Central Asia (excluding high income)Europe & Central Asia (IDA & IBRD countries)European UnionFaroe IslandsFijiFinlandFragile and conflict affected situationsFranceFrench PolynesiaGabonGambia, TheGeorgiaGermanyGhanaGreeceGrenadaGuatemalaGuineaGuinea-BissauGuyanaHaitiHeavily indebted poor countries (HIPC)High incomeHondurasHong Kong SAR, ChinaHungaryIBRD onlyIcelandIDA & IBRD totalIDA onlyIDA totalIndiaIndonesiaIran, Islamic Rep.IraqIrelandIsraelItalyJamaicaJapanJordanKazakhstanKenyaKiribatiKorea, Rep.KosovoKuwaitKyrgyz RepublicLao PDRLate-demographic dividendLatin America & Caribbean Latin America & Caribbean (excluding high income)Latin America & the Caribbean (IDA & IBRD countries)LatviaLeast developed countries: UN classificationLebanonLesothoLiberiaLibyaLithuaniaLow & middle incomeLow incomeLower middle incomeLuxembourgMacao SAR, ChinaMacedonia, FYRMadagascarMalawiMalaysiaMaldivesMaliMaltaMarshall IslandsMauritaniaMauritiusMexicoMicronesia, Fed. Sts.Middle East & North AfricaMiddle East & North Africa (excluding high income)Middle East & North Africa (IDA & IBRD countries)Middle incomeMoldovaMongoliaMontenegroMoroccoMozambiqueMyanmarNamibiaNepalNetherlandsNew CaledoniaNew ZealandNicaraguaNigerNigeriaNorth AmericaNorwayOECD membersOmanOther small statesPacific island small statesPakistanPalauPanamaPapua New GuineaParaguayPeruPhilippinesPolandPortugalPost-demographic dividendPre-demographic dividendQatarRomaniaRussian FederationRwandaSamoaSao Tome and PrincipeSaudi ArabiaSenegalSerbiaSeychellesSierra LeoneSingaporeSint Maarten (Dutch part)Slovak RepublicSloveniaSmall statesSolomon IslandsSouth AfricaSouth AsiaSouth Asia (IDA & IBRD)South SudanSpainSri LankaSt. Kitts and NevisSt. LuciaSt. Vincent and the GrenadinesSub-Saharan Africa Sub-Saharan Africa (excluding high income)Sub-Saharan Africa (IDA & IBRD countries)SudanSurinameSwazilandSwedenSwitzerlandSyrian Arab RepublicTajikistanTanzaniaThailandTimor-LesteTogoTongaTrinidad and TobagoTunisiaTurkeyTuvaluUgandaUkraineUnited KingdomUnited StatesUpper middle incomeUruguayVanuatuVenezuela, RBWest Bank and GazaWorldYemen, Rep.ZambiaZimbabwe línea de tiempo (timeline):
En esta escala de tiempo se presenta un gráfico de 1978 y 2014 de Libya. Los datos de 1977 están ausentes. El número de observaciones reales por fecha: 37.
Fuente (nombre):
Indicadores del desarrollo mundial
Fuente (organización):
International Monetary Fund, Balance of Payments Statistics Yearbook and data files.
Categorías:
Economy & Growth, Trade
Se ha actualizado:
23 abr 2017 año
Los indicadores de los cambios de valor en los últimos años
Mínimo:
19.767
1 ene 1992 año
Máximo:
71.162
1 ene 1997 año
A la fecha de observación
Valor
Cambio absoluto
El cambio con respecto al valor anterior
1 ene 1978 año
46.521
+46.521
0.0%
1 ene 1979 año
47.038
+0.517
1.11%
1 ene 1980 año
50.346
+3.308
7.03%
1 ene 1981 año
51.379
+1.033
2.05%
1 ene 1982 año
60.419
+9.04
17.6%
1 ene 1983 año
58.052
-2.366
-3.92%
1 ene 1984 año
43.901
-14.151
-24.38%
1 ene 1985 año
43.42
-0.481
-1.1%
1 ene 1986 año
37.648
-5.773
-13.3%
1 ene 1987 año
45.482
+7.835
20.81%
1 ene 1988 año
37.931
-7.551
-16.6%
1 ene 1989 año
23.199
-14.732
-38.84%
1 ene 1990 año
24.544
+1.345
5.8%
1 ene 1991 año
27.989
+3.445
14.04%
1 ene 1992 año
19.767
-8.221
-29.37%
1 ene 1993 año
40.471
+20.704
104.74%
1 ene 1994 año
40.89
+0.419
1.03%
1 ene 1995 año
58.33
+17.44
42.65%
1 ene 1996 año
53.6
-4.73
-8.11%
1 ene 1997 año
71.162
+17.562
32.77%
1 ene 1998 año
43.848
-27.314
-38.38%
1 ene 1999 año
36.271
-7.577
-17.28%
1 ene 2000 año
40.951
+4.68
12.9%
1 ene 2001 año
39.106
-1.845
-4.5%
1 ene 2002 año
43.81
+4.704
12.03%
1 ene 2003 año
33.808
-10.002
-22.83%
1 ene 2004 año
41.39
+7.582
22.43%
1 ene 2005 año
40.021
-1.369
-3.31%
1 ene 2006 año
43.252
+3.232
8.07%
1 ene 2007 año
46.1
+2.847
6.58%
1 ene 2008 año
48.131
+2.031
4.41%
1 ene 2009 año
34.184
-13.947
-28.98%
1 ene 2010 año
40.889
+6.705
19.62%
1 ene 2011 año
38.186
-2.703
-6.61%
1 ene 2012 año
22.697
-15.488
-40.56%
1 ene 2013 año
34.639
+11.941
52.61%
1 ene 2014 año
38.583
+3.945
11.39%
Ranking de los países por los datos estadísticos actuales


Comentarios: