29
/es/
es
AIzaSyAYiBZKx7MnpbEhh9jyipgxe19OcubqV5w
April 1, 2024
134695
France
FRA
true
2
1
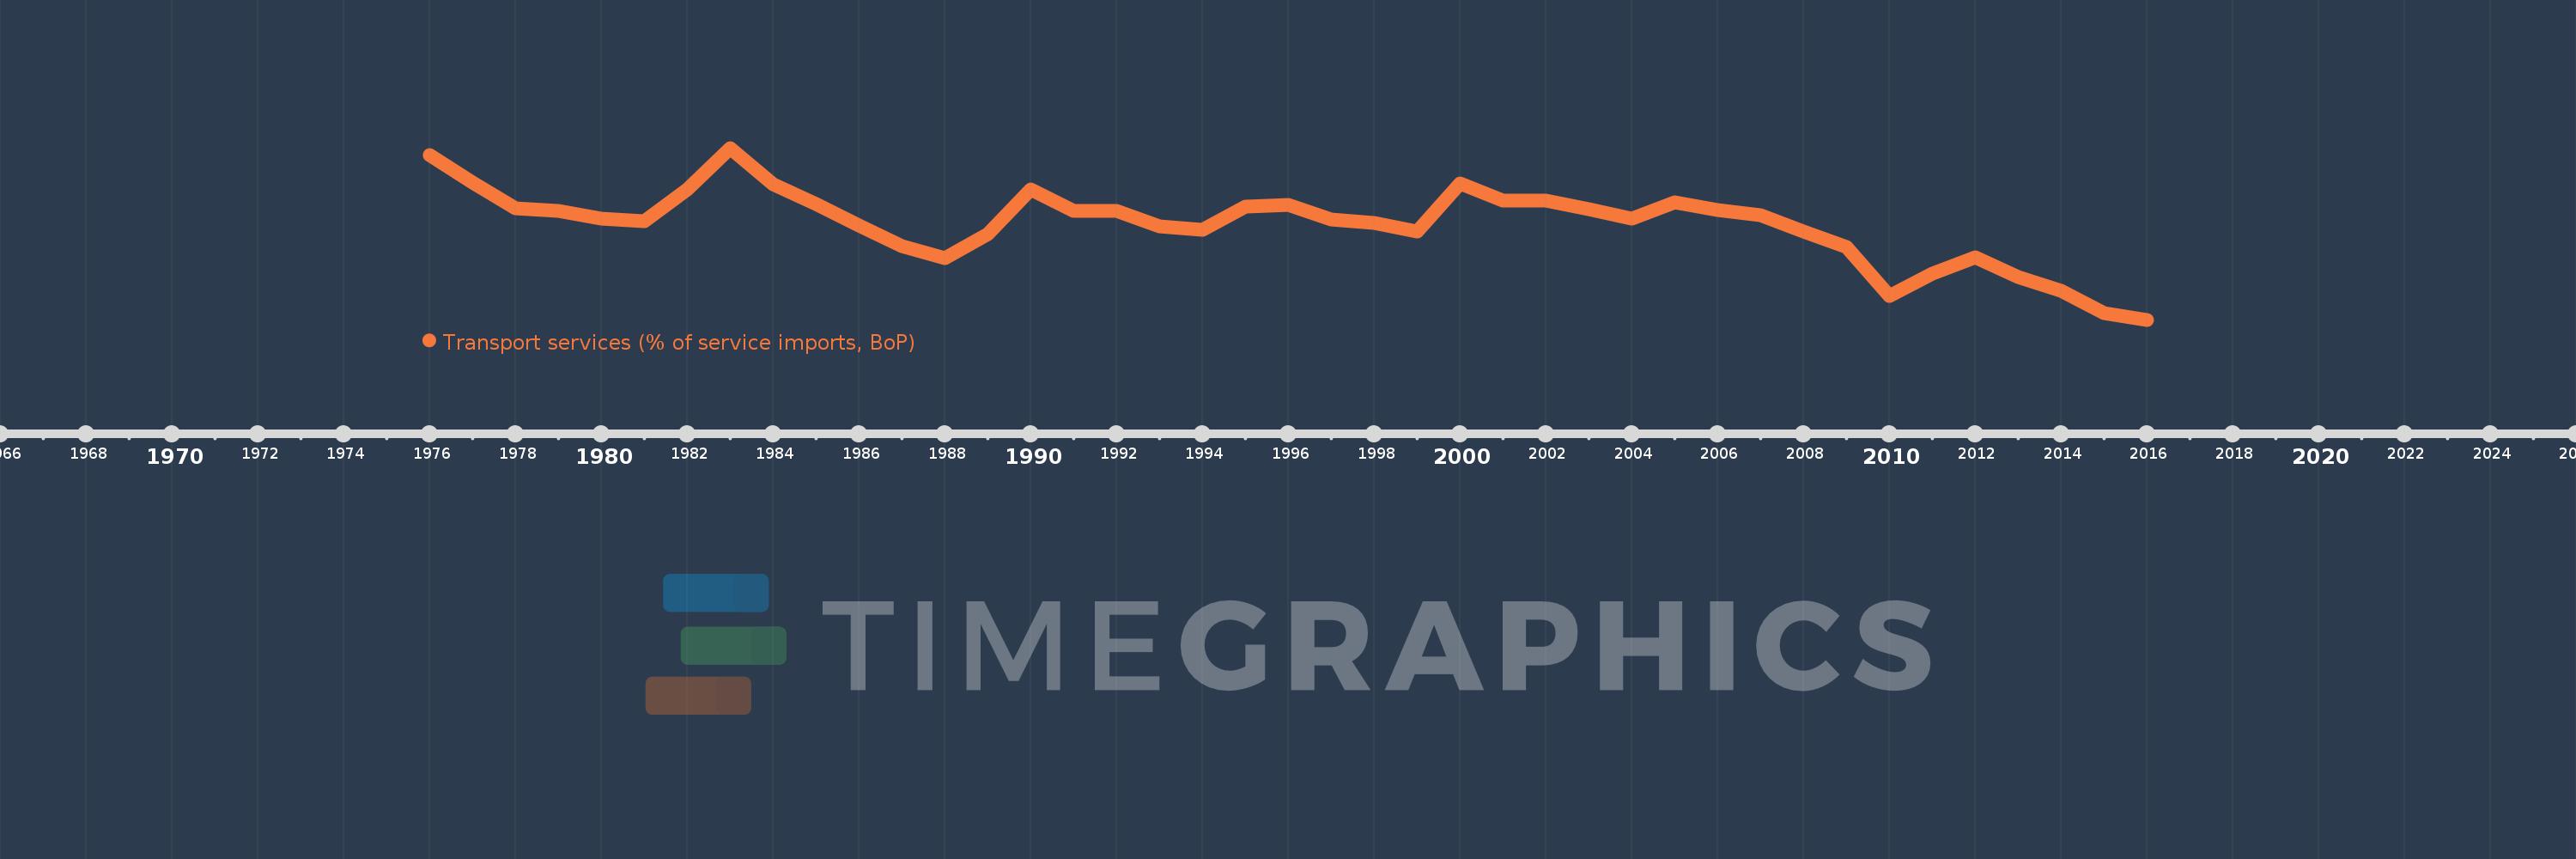
Transport services (% of service imports, BoP)
2016,2015,2014,2013,2012,2011,2010,2009,2008,2007,2006,2005,2004,2003,2002,2001,2000,1999,1998,1997,1996,1995,1994,1993,1992,1991,1990,1989,1988,1987,1986,1985,1984,1983,1982,1981,1980,1979,1978,1977,1976
Estas estadísticas en otros países:
AfghanistanAlbaniaAlgeriaAngolaAntigua and BarbudaArab WorldArgentinaArmeniaArubaAustraliaAustriaAzerbaijanBahamas, TheBahrainBangladeshBarbadosBelarusBelgiumBelizeBeninBermudaBhutanBoliviaBosnia and HerzegovinaBotswanaBrazilBrunei DarussalamBulgariaBurkina FasoBurundiCabo VerdeCambodiaCameroonCanadaCaribbean small statesCentral African RepublicCentral Europe and the BalticsChadChileChinaColombiaComorosCongo, Dem. Rep.Congo, Rep.Costa RicaCote d'IvoireCroatiaCuracaoCyprusCzech RepublicDenmarkDjiboutiDominicaDominican RepublicEarly-demographic dividendEast Asia & PacificEast Asia & Pacific (excluding high income)East Asia & Pacific (IDA & IBRD countries)EcuadorEgypt, Arab Rep.El SalvadorEquatorial GuineaEritreaEstoniaEthiopiaEuro areaEurope & Central AsiaEurope & Central Asia (excluding high income)Europe & Central Asia (IDA & IBRD countries)European UnionFaroe IslandsFijiFinlandFragile and conflict affected situationsFranceFrench PolynesiaGabonGambia, TheGeorgiaGermanyGhanaGreeceGrenadaGuatemalaGuineaGuinea-BissauGuyanaHaitiHeavily indebted poor countries (HIPC)High incomeHondurasHong Kong SAR, ChinaHungaryIBRD onlyIcelandIDA & IBRD totalIDA onlyIDA totalIndiaIndonesiaIran, Islamic Rep.IraqIrelandIsraelItalyJamaicaJapanJordanKazakhstanKenyaKiribatiKorea, Rep.KosovoKuwaitKyrgyz RepublicLao PDRLate-demographic dividendLatin America & Caribbean Latin America & Caribbean (excluding high income)Latin America & the Caribbean (IDA & IBRD countries)LatviaLeast developed countries: UN classificationLebanonLesothoLiberiaLibyaLithuaniaLow & middle incomeLow incomeLower middle incomeLuxembourgMacao SAR, ChinaMacedonia, FYRMadagascarMalawiMalaysiaMaldivesMaliMaltaMarshall IslandsMauritaniaMauritiusMexicoMicronesia, Fed. Sts.Middle East & North AfricaMiddle East & North Africa (excluding high income)Middle East & North Africa (IDA & IBRD countries)Middle incomeMoldovaMongoliaMontenegroMoroccoMozambiqueMyanmarNamibiaNepalNetherlandsNew CaledoniaNew ZealandNicaraguaNigerNigeriaNorth AmericaNorwayOECD membersOmanOther small statesPacific island small statesPakistanPalauPanamaPapua New GuineaParaguayPeruPhilippinesPolandPortugalPost-demographic dividendPre-demographic dividendQatarRomaniaRussian FederationRwandaSamoaSao Tome and PrincipeSaudi ArabiaSenegalSerbiaSeychellesSierra LeoneSingaporeSint Maarten (Dutch part)Slovak RepublicSloveniaSmall statesSolomon IslandsSouth AfricaSouth AsiaSouth Asia (IDA & IBRD)South SudanSpainSri LankaSt. Kitts and NevisSt. LuciaSt. Vincent and the GrenadinesSub-Saharan Africa Sub-Saharan Africa (excluding high income)Sub-Saharan Africa (IDA & IBRD countries)SudanSurinameSwazilandSwedenSwitzerlandSyrian Arab RepublicTajikistanTanzaniaThailandTimor-LesteTogoTongaTrinidad and TobagoTunisiaTurkeyTuvaluUgandaUkraineUnited KingdomUnited StatesUpper middle incomeUruguayVanuatuVenezuela, RBWest Bank and GazaWorldYemen, Rep.ZambiaZimbabwe línea de tiempo (timeline):
En esta escala de tiempo se presenta un gráfico de 1976 y 2016 de France. Los datos de 1975 están ausentes. El número de observaciones reales por fecha: 41.
Fuente (nombre):
Indicadores del desarrollo mundial
Fuente (organización):
International Monetary Fund, Balance of Payments Statistics Yearbook and data files.
Categorías:
Economy & Growth, Trade
Se ha actualizado:
23 abr 2017 año
Los indicadores de los cambios de valor en los últimos años
Mínimo:
20.16
1 ene 2016 año
Máximo:
32.638
1 ene 1983 año
A la fecha de observación
Valor
Cambio absoluto
El cambio con respecto al valor anterior
1 ene 1976 año
32.094
+32.094
0.0%
1 ene 1977 año
30.138
-1.956
-6.09%
1 ene 1978 año
28.222
-1.916
-6.36%
1 ene 1979 año
28.073
-0.148
-0.53%
1 ene 1980 año
27.522
-0.551
-1.96%
1 ene 1981 año
27.307
-0.215
-0.78%
1 ene 1982 año
29.621
+2.314
8.47%
1 ene 1983 año
32.638
+3.018
10.19%
1 ene 1984 año
30.024
-2.614
-8.01%
1 ene 1985 año
28.593
-1.431
-4.77%
1 ene 1986 año
27.028
-1.565
-5.47%
1 ene 1987 año
25.526
-1.502
-5.56%
1 ene 1988 año
24.608
-0.917
-3.59%
1 ene 1989 año
26.383
+1.775
7.21%
1 ene 1990 año
29.617
+3.233
12.26%
1 ene 1991 año
28.084
-1.533
-5.17%
1 ene 1992 año
28.039
-0.046
-0.16%
1 ene 1993 año
26.914
-1.124
-4.01%
1 ene 1994 año
26.685
-0.229
-0.85%
1 ene 1995 año
28.356
+1.67
6.26%
1 ene 1996 año
28.502
+0.146
0.52%
1 ene 1997 año
27.439
-1.063
-3.73%
1 ene 1998 año
27.203
-0.236
-0.86%
1 ene 1999 año
26.572
-0.631
-2.32%
1 ene 2000 año
30.078
+3.507
13.2%
1 ene 2001 año
28.804
-1.274
-4.24%
1 ene 2002 año
28.794
-0.011
-0.04%
1 ene 2003 año
28.215
-0.579
-2.01%
1 ene 2004 año
27.523
-0.691
-2.45%
1 ene 2005 año
28.706
+1.183
4.3%
1 ene 2006 año
28.141
-0.565
-1.97%
1 ene 2007 año
27.759
-0.382
-1.36%
1 ene 2008 año
26.545
-1.214
-4.37%
1 ene 2009 año
25.461
-1.085
-4.09%
1 ene 2010 año
21.905
-3.555
-13.96%
1 ene 2011 año
23.484
+1.578
7.21%
1 ene 2012 año
24.703
+1.219
5.19%
1 ene 2013 año
23.23
-1.473
-5.96%
1 ene 2014 año
22.291
-0.939
-4.04%
1 ene 2015 año
20.612
-1.679
-7.53%
1 ene 2016 año
20.16
-0.453
-2.2%
Ranking de los países por los datos estadísticos actuales


Comentarios: