29
/es/
es
AIzaSyAYiBZKx7MnpbEhh9jyipgxe19OcubqV5w
April 1, 2024
278368
Uruguay
URY
true
2
1
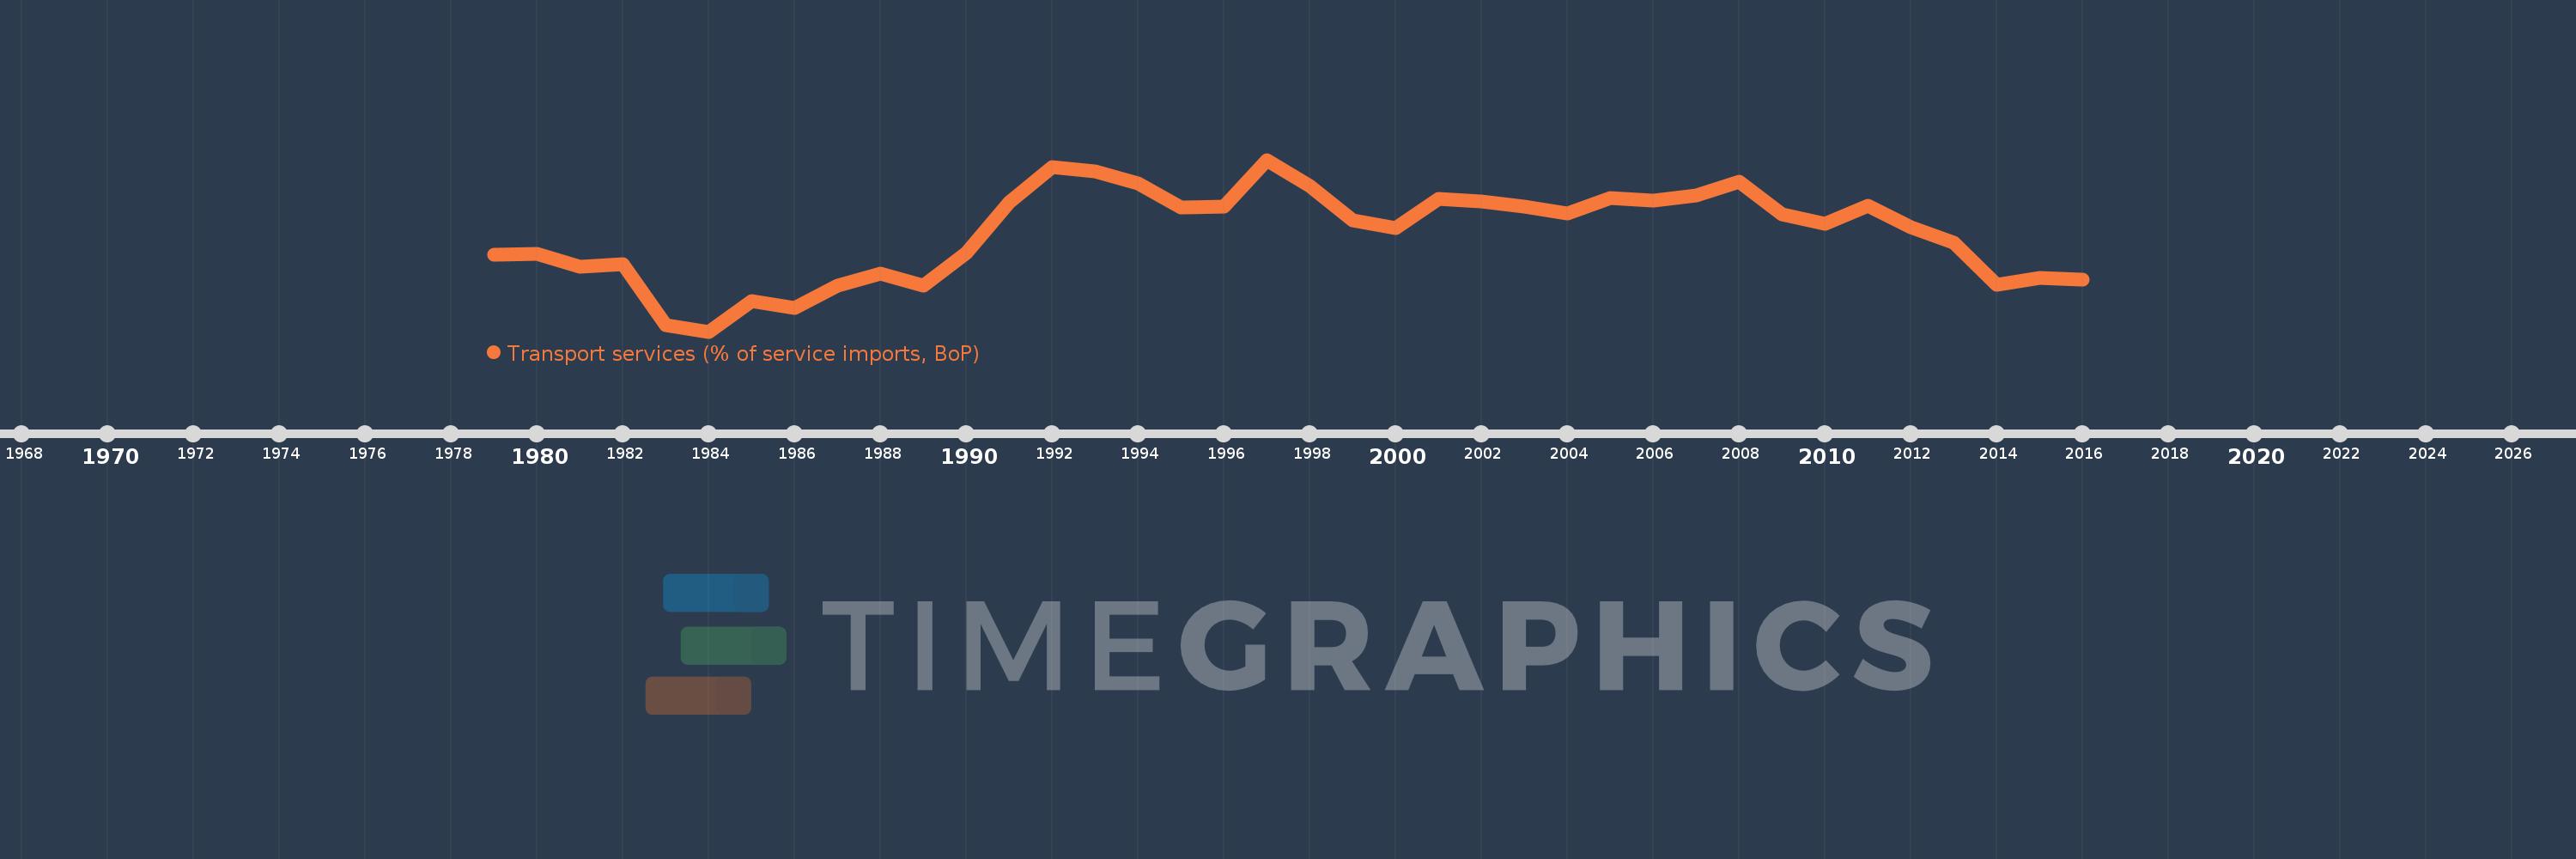
Transport services (% of service imports, BoP)
2016,2015,2014,2013,2012,2011,2010,2009,2008,2007,2006,2005,2004,2003,2002,2001,2000,1999,1998,1997,1996,1995,1994,1993,1992,1991,1990,1989,1988,1987,1986,1985,1984,1983,1982,1981,1980,1979
Estas estadísticas en otros países:
AfghanistanAlbaniaAlgeriaAngolaAntigua and BarbudaArab WorldArgentinaArmeniaArubaAustraliaAustriaAzerbaijanBahamas, TheBahrainBangladeshBarbadosBelarusBelgiumBelizeBeninBermudaBhutanBoliviaBosnia and HerzegovinaBotswanaBrazilBrunei DarussalamBulgariaBurkina FasoBurundiCabo VerdeCambodiaCameroonCanadaCaribbean small statesCentral African RepublicCentral Europe and the BalticsChadChileChinaColombiaComorosCongo, Dem. Rep.Congo, Rep.Costa RicaCote d'IvoireCroatiaCuracaoCyprusCzech RepublicDenmarkDjiboutiDominicaDominican RepublicEarly-demographic dividendEast Asia & PacificEast Asia & Pacific (excluding high income)East Asia & Pacific (IDA & IBRD countries)EcuadorEgypt, Arab Rep.El SalvadorEquatorial GuineaEritreaEstoniaEthiopiaEuro areaEurope & Central AsiaEurope & Central Asia (excluding high income)Europe & Central Asia (IDA & IBRD countries)European UnionFaroe IslandsFijiFinlandFragile and conflict affected situationsFranceFrench PolynesiaGabonGambia, TheGeorgiaGermanyGhanaGreeceGrenadaGuatemalaGuineaGuinea-BissauGuyanaHaitiHeavily indebted poor countries (HIPC)High incomeHondurasHong Kong SAR, ChinaHungaryIBRD onlyIcelandIDA & IBRD totalIDA onlyIDA totalIndiaIndonesiaIran, Islamic Rep.IraqIrelandIsraelItalyJamaicaJapanJordanKazakhstanKenyaKiribatiKorea, Rep.KosovoKuwaitKyrgyz RepublicLao PDRLate-demographic dividendLatin America & Caribbean Latin America & Caribbean (excluding high income)Latin America & the Caribbean (IDA & IBRD countries)LatviaLeast developed countries: UN classificationLebanonLesothoLiberiaLibyaLithuaniaLow & middle incomeLow incomeLower middle incomeLuxembourgMacao SAR, ChinaMacedonia, FYRMadagascarMalawiMalaysiaMaldivesMaliMaltaMarshall IslandsMauritaniaMauritiusMexicoMicronesia, Fed. Sts.Middle East & North AfricaMiddle East & North Africa (excluding high income)Middle East & North Africa (IDA & IBRD countries)Middle incomeMoldovaMongoliaMontenegroMoroccoMozambiqueMyanmarNamibiaNepalNetherlandsNew CaledoniaNew ZealandNicaraguaNigerNigeriaNorth AmericaNorwayOECD membersOmanOther small statesPacific island small statesPakistanPalauPanamaPapua New GuineaParaguayPeruPhilippinesPolandPortugalPost-demographic dividendPre-demographic dividendQatarRomaniaRussian FederationRwandaSamoaSao Tome and PrincipeSaudi ArabiaSenegalSerbiaSeychellesSierra LeoneSingaporeSint Maarten (Dutch part)Slovak RepublicSloveniaSmall statesSolomon IslandsSouth AfricaSouth AsiaSouth Asia (IDA & IBRD)South SudanSpainSri LankaSt. Kitts and NevisSt. LuciaSt. Vincent and the GrenadinesSub-Saharan Africa Sub-Saharan Africa (excluding high income)Sub-Saharan Africa (IDA & IBRD countries)SudanSurinameSwazilandSwedenSwitzerlandSyrian Arab RepublicTajikistanTanzaniaThailandTimor-LesteTogoTongaTrinidad and TobagoTunisiaTurkeyTuvaluUgandaUkraineUnited KingdomUnited StatesUpper middle incomeUruguayVanuatuVenezuela, RBWest Bank and GazaWorldYemen, Rep.ZambiaZimbabwe línea de tiempo (timeline):
En esta escala de tiempo se presenta un gráfico de 1979 y 2016 de Uruguay. Los datos de 1978 están ausentes. El número de observaciones reales por fecha: 38.
Fuente (nombre):
Indicadores del desarrollo mundial
Fuente (organización):
International Monetary Fund, Balance of Payments Statistics Yearbook and data files.
Categorías:
Economy & Growth, Trade
Se ha actualizado:
23 abr 2017 año
Los indicadores de los cambios de valor en los últimos años
Mínimo:
18.887
1 ene 1984 año
Máximo:
53.147
1 ene 1997 año
A la fecha de observación
Valor
Cambio absoluto
El cambio con respecto al valor anterior
1 ene 1979 año
34.274
+34.274
0.0%
1 ene 1980 año
34.459
+0.185
0.54%
1 ene 1981 año
31.807
-2.652
-7.7%
1 ene 1982 año
32.386
+0.579
1.82%
1 ene 1983 año
20.245
-12.141
-37.49%
1 ene 1984 año
18.887
-1.358
-6.71%
1 ene 1985 año
25.013
+6.127
32.44%
1 ene 1986 año
23.554
-1.459
-5.83%
1 ene 1987 año
28.0
+4.446
18.88%
1 ene 1988 año
30.483
+2.483
8.87%
1 ene 1989 año
28.089
-2.395
-7.86%
1 ene 1990 año
34.549
+6.46
23.0%
1 ene 1991 año
44.586
+10.037
29.05%
1 ene 1992 año
51.694
+7.108
15.94%
1 ene 1993 año
50.911
-0.783
-1.51%
1 ene 1994 año
48.456
-2.455
-4.82%
1 ene 1995 año
43.663
-4.793
-9.89%
1 ene 1996 año
43.885
+0.222
0.51%
1 ene 1997 año
53.147
+9.262
21.1%
1 ene 1998 año
47.929
-5.217
-9.82%
1 ene 1999 año
41.003
-6.927
-14.45%
1 ene 2000 año
39.486
-1.516
-3.7%
1 ene 2001 año
45.312
+5.826
14.75%
1 ene 2002 año
44.759
-0.553
-1.22%
1 ene 2003 año
43.76
-0.999
-2.23%
1 ene 2004 año
42.393
-1.367
-3.12%
1 ene 2005 año
45.501
+3.108
7.33%
1 ene 2006 año
45.042
-0.458
-1.01%
1 ene 2007 año
46.05
+1.008
2.24%
1 ene 2008 año
48.823
+2.773
6.02%
1 ene 2009 año
42.197
-6.627
-13.57%
1 ene 2010 año
40.442
-1.754
-4.16%
1 ene 2011 año
43.975
+3.533
8.74%
1 ene 2012 año
39.664
-4.311
-9.8%
1 ene 2013 año
36.582
-3.082
-7.77%
1 ene 2014 año
28.239
-8.343
-22.81%
1 ene 2015 año
29.57
+1.331
4.71%
1 ene 2016 año
29.232
-0.338
-1.14%
Ranking de los países por los datos estadísticos actuales


Comentarios: