29
/es/
es
AIzaSyAYiBZKx7MnpbEhh9jyipgxe19OcubqV5w
April 1, 2024
191038
Mali
MLI
true
2
1
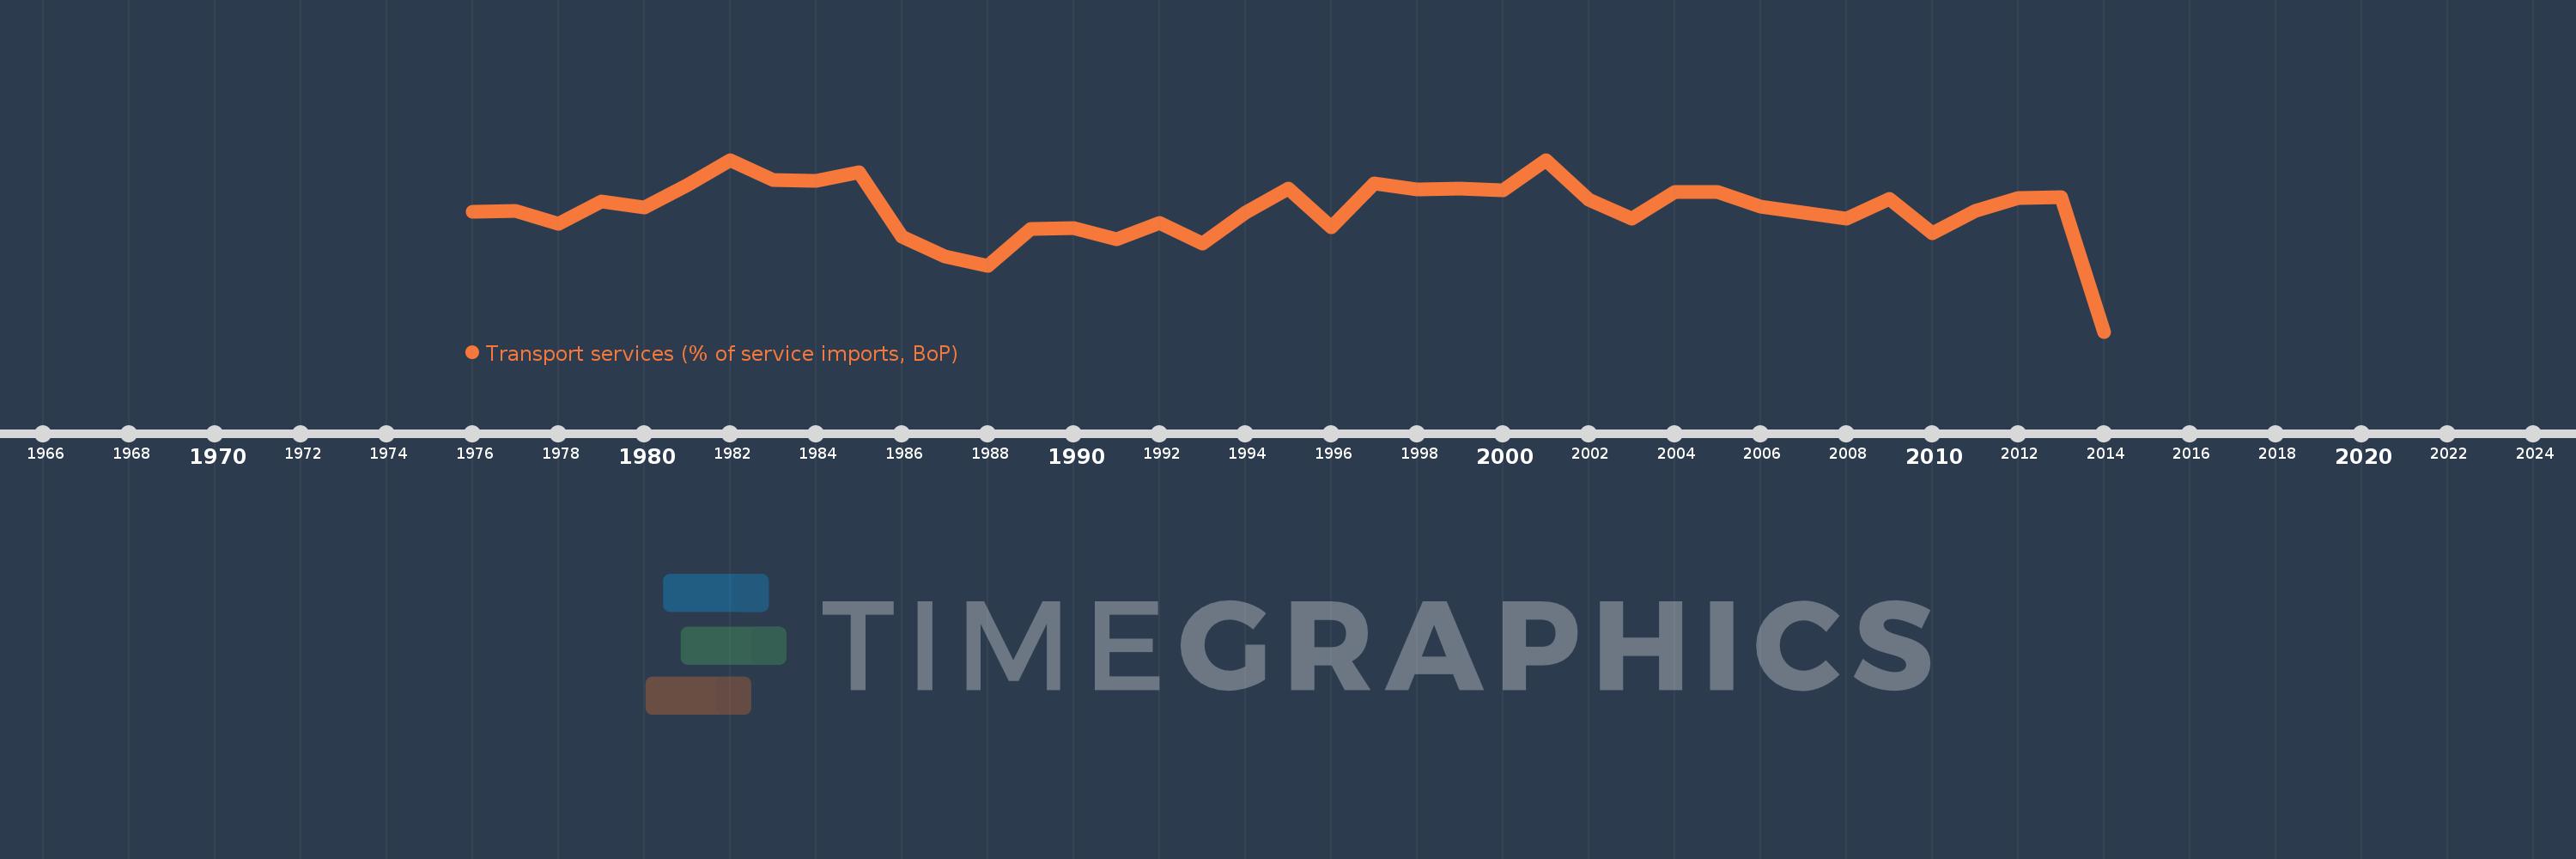
Transport services (% of service imports, BoP)
2014,2013,2012,2011,2010,2009,2008,2007,2006,2005,2004,2003,2002,2001,2000,1999,1998,1997,1996,1995,1994,1993,1992,1991,1990,1989,1988,1987,1986,1985,1984,1983,1982,1981,1980,1979,1978,1977,1976
Estas estadísticas en otros países:
AfghanistanAlbaniaAlgeriaAngolaAntigua and BarbudaArab WorldArgentinaArmeniaArubaAustraliaAustriaAzerbaijanBahamas, TheBahrainBangladeshBarbadosBelarusBelgiumBelizeBeninBermudaBhutanBoliviaBosnia and HerzegovinaBotswanaBrazilBrunei DarussalamBulgariaBurkina FasoBurundiCabo VerdeCambodiaCameroonCanadaCaribbean small statesCentral African RepublicCentral Europe and the BalticsChadChileChinaColombiaComorosCongo, Dem. Rep.Congo, Rep.Costa RicaCote d'IvoireCroatiaCuracaoCyprusCzech RepublicDenmarkDjiboutiDominicaDominican RepublicEarly-demographic dividendEast Asia & PacificEast Asia & Pacific (excluding high income)East Asia & Pacific (IDA & IBRD countries)EcuadorEgypt, Arab Rep.El SalvadorEquatorial GuineaEritreaEstoniaEthiopiaEuro areaEurope & Central AsiaEurope & Central Asia (excluding high income)Europe & Central Asia (IDA & IBRD countries)European UnionFaroe IslandsFijiFinlandFragile and conflict affected situationsFranceFrench PolynesiaGabonGambia, TheGeorgiaGermanyGhanaGreeceGrenadaGuatemalaGuineaGuinea-BissauGuyanaHaitiHeavily indebted poor countries (HIPC)High incomeHondurasHong Kong SAR, ChinaHungaryIBRD onlyIcelandIDA & IBRD totalIDA onlyIDA totalIndiaIndonesiaIran, Islamic Rep.IraqIrelandIsraelItalyJamaicaJapanJordanKazakhstanKenyaKiribatiKorea, Rep.KosovoKuwaitKyrgyz RepublicLao PDRLate-demographic dividendLatin America & Caribbean Latin America & Caribbean (excluding high income)Latin America & the Caribbean (IDA & IBRD countries)LatviaLeast developed countries: UN classificationLebanonLesothoLiberiaLibyaLithuaniaLow & middle incomeLow incomeLower middle incomeLuxembourgMacao SAR, ChinaMacedonia, FYRMadagascarMalawiMalaysiaMaldivesMaliMaltaMarshall IslandsMauritaniaMauritiusMexicoMicronesia, Fed. Sts.Middle East & North AfricaMiddle East & North Africa (excluding high income)Middle East & North Africa (IDA & IBRD countries)Middle incomeMoldovaMongoliaMontenegroMoroccoMozambiqueMyanmarNamibiaNepalNetherlandsNew CaledoniaNew ZealandNicaraguaNigerNigeriaNorth AmericaNorwayOECD membersOmanOther small statesPacific island small statesPakistanPalauPanamaPapua New GuineaParaguayPeruPhilippinesPolandPortugalPost-demographic dividendPre-demographic dividendQatarRomaniaRussian FederationRwandaSamoaSao Tome and PrincipeSaudi ArabiaSenegalSerbiaSeychellesSierra LeoneSingaporeSint Maarten (Dutch part)Slovak RepublicSloveniaSmall statesSolomon IslandsSouth AfricaSouth AsiaSouth Asia (IDA & IBRD)South SudanSpainSri LankaSt. Kitts and NevisSt. LuciaSt. Vincent and the GrenadinesSub-Saharan Africa Sub-Saharan Africa (excluding high income)Sub-Saharan Africa (IDA & IBRD countries)SudanSurinameSwazilandSwedenSwitzerlandSyrian Arab RepublicTajikistanTanzaniaThailandTimor-LesteTogoTongaTrinidad and TobagoTunisiaTurkeyTuvaluUgandaUkraineUnited KingdomUnited StatesUpper middle incomeUruguayVanuatuVenezuela, RBWest Bank and GazaWorldYemen, Rep.ZambiaZimbabwe línea de tiempo (timeline):
En esta escala de tiempo se presenta un gráfico de 1976 y 2014 de Mali. Los datos de 1975 están ausentes. El número de observaciones reales por fecha: 39.
Fuente (nombre):
Indicadores del desarrollo mundial
Fuente (organización):
International Monetary Fund, Balance of Payments Statistics Yearbook and data files.
Categorías:
Economy & Growth, Trade
Se ha actualizado:
23 abr 2017 año
Los indicadores de los cambios de valor en los últimos años
Mínimo:
34.022
1 ene 2014 año
Máximo:
71.277
1 ene 2001 año
A la fecha de observación
Valor
Cambio absoluto
El cambio con respecto al valor anterior
1 ene 1976 año
60.057
+60.057
0.0%
1 ene 1977 año
60.133
+0.076
0.13%
1 ene 1978 año
57.484
-2.649
-4.41%
1 ene 1979 año
62.265
+4.781
8.32%
1 ene 1980 año
60.846
-1.418
-2.28%
1 ene 1981 año
65.832
+4.986
8.19%
1 ene 1982 año
71.275
+5.442
8.27%
1 ene 1983 año
66.838
-4.436
-6.22%
1 ene 1984 año
66.69
-0.148
-0.22%
1 ene 1985 año
68.603
+1.912
2.87%
1 ene 1986 año
54.622
-13.981
-20.38%
1 ene 1987 año
50.352
-4.27
-7.82%
1 ene 1988 año
48.199
-2.153
-4.28%
1 ene 1989 año
56.333
+8.134
16.88%
1 ene 1990 año
56.398
+0.065
0.12%
1 ene 1991 año
53.966
-2.432
-4.31%
1 ene 1992 año
57.608
+3.641
6.75%
1 ene 1993 año
53.094
-4.513
-7.83%
1 ene 1994 año
59.841
+6.747
12.71%
1 ene 1995 año
64.957
+5.115
8.55%
1 ene 1996 año
56.574
-8.382
-12.9%
1 ene 1997 año
66.149
+9.575
16.92%
1 ene 1998 año
64.762
-1.387
-2.1%
1 ene 1999 año
65.007
+0.245
0.38%
1 ene 2000 año
64.601
-0.406
-0.62%
1 ene 2001 año
71.277
+6.677
10.34%
1 ene 2002 año
62.628
-8.65
-12.14%
1 ene 2003 año
58.577
-4.051
-6.47%
1 ene 2004 año
64.351
+5.774
9.86%
1 ene 2005 año
64.214
-0.137
-0.21%
1 ene 2006 año
61.199
-3.014
-4.69%
1 ene 2007 año
59.911
-1.288
-2.1%
1 ene 2008 año
58.455
-1.456
-2.43%
1 ene 2009 año
62.792
+4.337
7.42%
1 ene 2010 año
55.443
-7.349
-11.7%
1 ene 2011 año
60.227
+4.784
8.63%
1 ene 2012 año
62.963
+2.736
4.54%
1 ene 2013 año
63.204
+0.241
0.38%
1 ene 2014 año
34.022
-29.183
-46.17%
Ranking de los países por los datos estadísticos actuales


Comentarios: