29
/es/
es
AIzaSyAYiBZKx7MnpbEhh9jyipgxe19OcubqV5w
April 1, 2024
95314
Burkina Faso
BFA
true
2
1
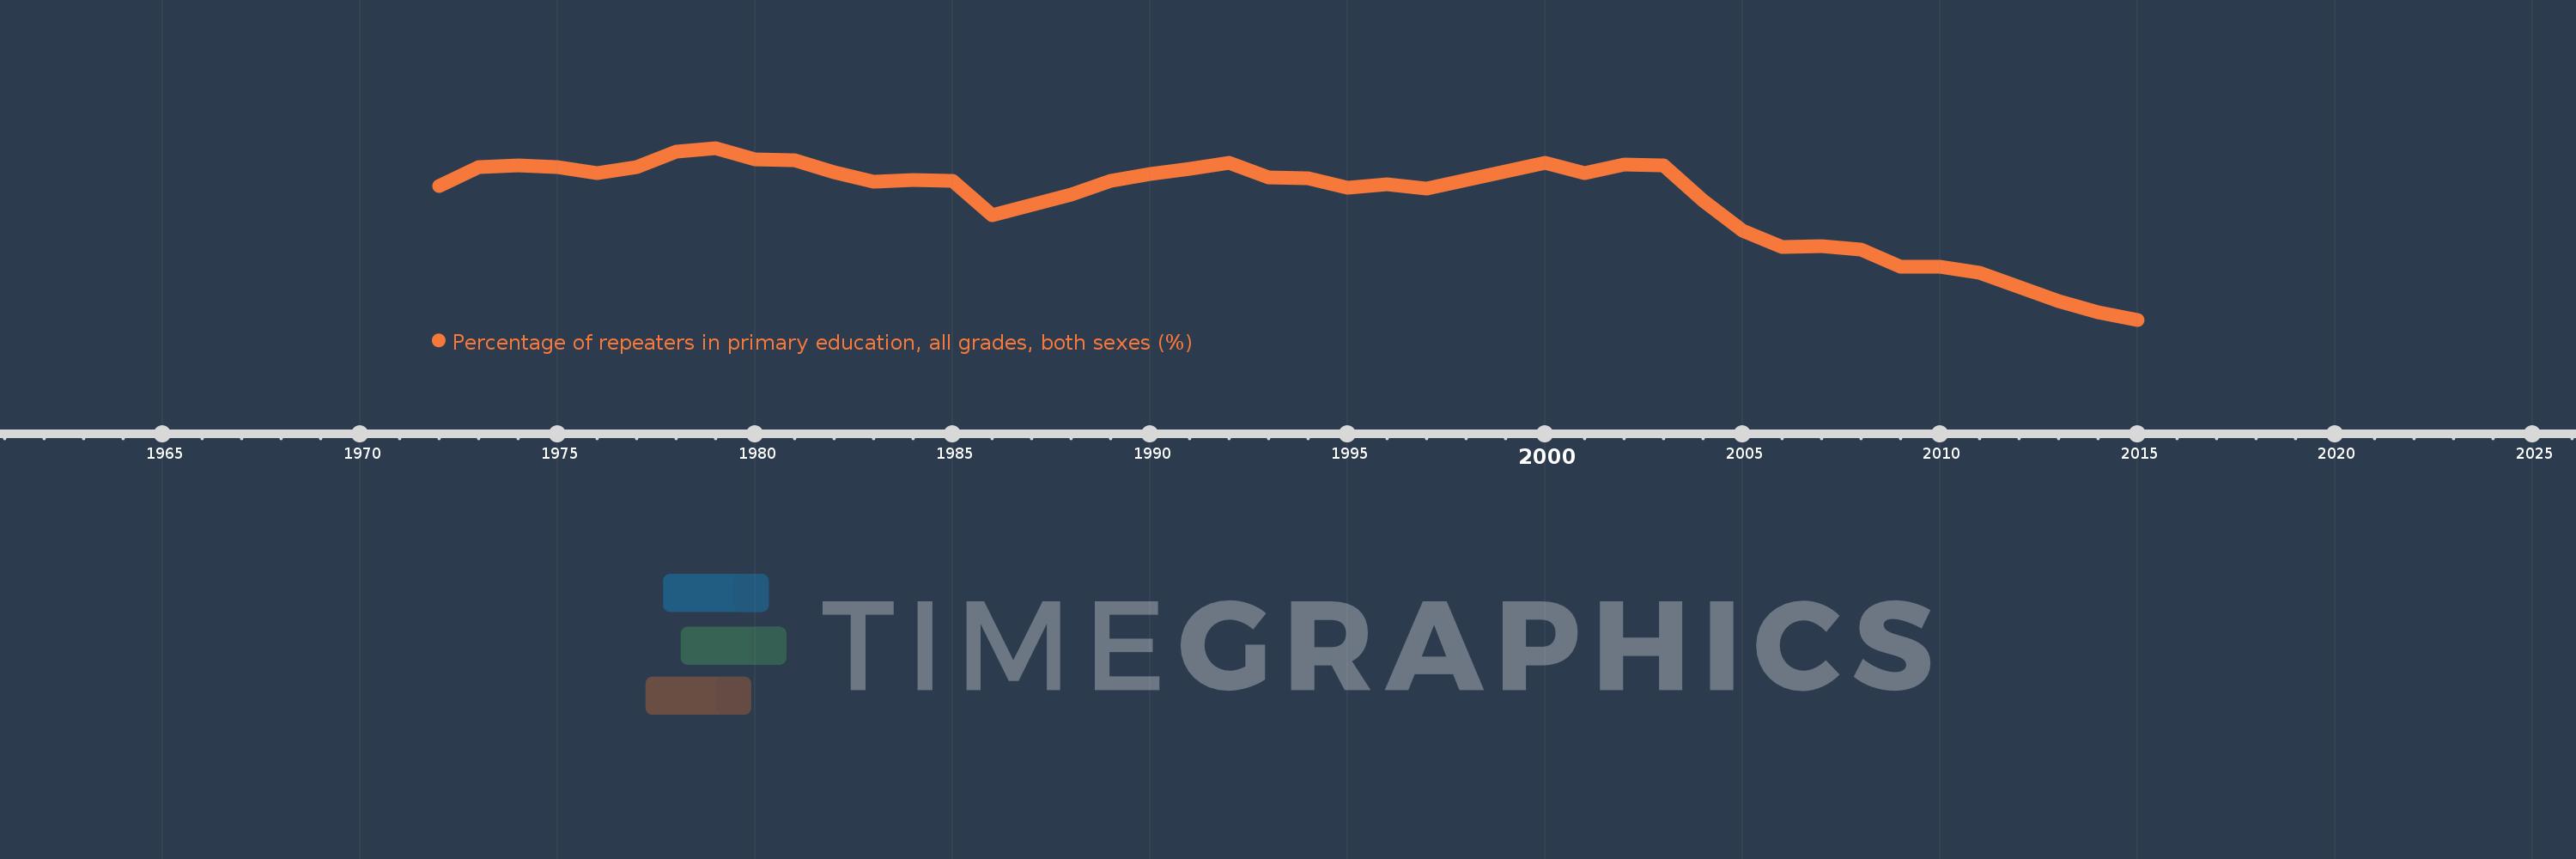
Percentage of repeaters in primary education, all grades, both sexes (%)
2015,2014,2013,2011,2010,2009,2008,2007,2006,2005,2004,2003,2002,2001,2000,1997,1996,1995,1994,1993,1992,1991,1990,1989,1988,1986,1985,1984,1983,1982,1981,1980,1979,1978,1977,1976,1975,1974,1973,1972
Estas estadísticas en otros países:
AfghanistanAlbaniaAlgeriaAndorraAngolaAntigua and BarbudaArab WorldArgentinaArmeniaArubaAustriaAzerbaijanBahamas, TheBahrainBangladeshBelarusBelgiumBelizeBeninBermudaBhutanBoliviaBosnia and HerzegovinaBotswanaBrazilBritish Virgin IslandsBrunei DarussalamBulgariaBurkina FasoBurundiCabo VerdeCambodiaCameroonCanadaCaribbean small statesCayman IslandsCentral African RepublicCentral Europe and the BalticsChadChileChinaColombiaComorosCongo, Dem. Rep.Congo, Rep.Costa RicaCote d'IvoireCroatiaCubaCyprusCzech RepublicDenmarkDjiboutiDominicaDominican RepublicEarly-demographic dividendEast Asia & PacificEast Asia & Pacific (excluding high income)East Asia & Pacific (IDA & IBRD countries)EcuadorEgypt, Arab Rep.El SalvadorEquatorial GuineaEritreaEstoniaEthiopiaEuro areaEurope & Central AsiaEurope & Central Asia (excluding high income)Europe & Central Asia (IDA & IBRD countries)European UnionFijiFinlandFragile and conflict affected situationsFranceGabonGambia, TheGeorgiaGermanyGhanaGreeceGrenadaGuatemalaGuineaGuinea-BissauGuyanaHaitiHeavily indebted poor countries (HIPC)High incomeHondurasHong Kong SAR, ChinaHungaryIBRD onlyIcelandIDA & IBRD totalIDA blendIDA onlyIDA totalIndiaIndonesiaIran, Islamic Rep.IraqIrelandIsraelItalyJamaicaJapanJordanKazakhstanKenyaKiribatiKorea, Rep.KuwaitKyrgyz RepublicLao PDRLate-demographic dividendLatin America & Caribbean Latin America & Caribbean (excluding high income)Latin America & the Caribbean (IDA & IBRD countries)LatviaLeast developed countries: UN classificationLebanonLesothoLiberiaLibyaLiechtensteinLithuaniaLow & middle incomeLow incomeLower middle incomeLuxembourgMacao SAR, ChinaMacedonia, FYRMadagascarMalawiMalaysiaMaldivesMaliMaltaMauritaniaMauritiusMexicoMiddle East & North AfricaMiddle East & North Africa (excluding high income)Middle East & North Africa (IDA & IBRD countries)Middle incomeMoldovaMonacoMongoliaMontenegroMoroccoMozambiqueMyanmarNamibiaNauruNepalNetherlandsNew ZealandNicaraguaNigerNorwayOECD membersOmanOther small statesPacific island small statesPakistanPalauPanamaPapua New GuineaParaguayPeruPhilippinesPolandPortugalPost-demographic dividendPre-demographic dividendQatarRomaniaRussian FederationRwandaSamoaSan MarinoSao Tome and PrincipeSaudi ArabiaSenegalSerbiaSeychellesSierra LeoneSingaporeSint Maarten (Dutch part)Slovak RepublicSloveniaSmall statesSolomon IslandsSomaliaSouth AfricaSouth AsiaSouth Asia (IDA & IBRD)South SudanSpainSri LankaSt. Kitts and NevisSt. LuciaSt. Vincent and the GrenadinesSub-Saharan Africa Sub-Saharan Africa (excluding high income)Sub-Saharan Africa (IDA & IBRD countries)SudanSurinameSwazilandSwedenSwitzerlandSyrian Arab RepublicTajikistanTanzaniaThailandTimor-LesteTogoTongaTrinidad and TobagoTunisiaTurkeyTurks and Caicos IslandsTuvaluUgandaUkraineUnited Arab EmiratesUnited KingdomUpper middle incomeUruguayUzbekistanVanuatuVenezuela, RBVietnamWest Bank and GazaWorldYemen, Rep.ZambiaZimbabwe línea de tiempo (timeline):
En esta escala de tiempo se presenta un gráfico de 1972 y 2015 de Burkina Faso. Los datos de 1971 están ausentes. El número de observaciones reales por fecha: 40.
Fuente (nombre):
Indicadores del desarrollo mundial
Fuente (organización):
UNESCO Institute for Statistics
Categorías:
Education
Se ha actualizado:
23 abr 2017 año
Los indicadores de los cambios de valor en los últimos años
Mínimo:
6.874
1 ene 2015 año
Máximo:
18.757
1 ene 1979 año
A la fecha de observación
Valor
Cambio absoluto
El cambio con respecto al valor anterior
1 ene 1972 año
16.147
+16.147
0.0%
1 ene 1973 año
17.439
+1.292
8.0%
1 ene 1974 año
17.543
+0.104
0.59%
1 ene 1975 año
17.442
-0.1
-0.57%
1 ene 1976 año
17.031
-0.411
-2.36%
1 ene 1977 año
17.452
+0.421
2.47%
1 ene 1978 año
18.525
+1.073
6.15%
1 ene 1979 año
18.757
+0.233
1.26%
1 ene 1980 año
17.956
-0.801
-4.27%
1 ene 1981 año
17.914
-0.042
-0.23%
1 ene 1982 año
17.09
-0.824
-4.6%
1 ene 1983 año
16.424
-0.666
-3.9%
1 ene 1984 año
16.57
+0.146
0.89%
1 ene 1985 año
16.511
-0.059
-0.36%
1 ene 1986 año
14.082
-2.429
-14.71%
1 ene 1988 año
15.509
+1.427
10.13%
1 ene 1989 año
16.511
+1.002
6.46%
1 ene 1990 año
16.951
+0.44
2.66%
1 ene 1991 año
17.306
+0.355
2.1%
1 ene 1992 año
17.749
+0.442
2.56%
1 ene 1993 año
16.709
-1.04
-5.86%
1 ene 1994 año
16.637
-0.072
-0.43%
1 ene 1995 año
15.995
-0.642
-3.86%
1 ene 1996 año
16.256
+0.261
1.63%
1 ene 1997 año
15.955
-0.301
-1.85%
1 ene 2000 año
17.711
+1.756
11.01%
1 ene 2001 año
17.033
-0.678
-3.83%
1 ene 2002 año
17.608
+0.575
3.38%
1 ene 2003 año
17.525
-0.083
-0.47%
1 ene 2004 año
15.09
-2.436
-13.9%
1 ene 2005 año
13.039
-2.05
-13.59%
1 ene 2006 año
11.927
-1.112
-8.53%
1 ene 2007 año
11.975
+0.048
0.41%
1 ene 2008 año
11.75
-0.225
-1.88%
1 ene 2009 año
10.516
-1.234
-10.5%
1 ene 2010 año
10.563
+0.047
0.45%
1 ene 2011 año
10.122
-0.44
-4.17%
1 ene 2013 año
8.18
-1.942
-19.19%
1 ene 2014 año
7.38
-0.801
-9.79%
1 ene 2015 año
6.874
-0.506
-6.85%
Ranking de los países por los datos estadísticos actuales


Comentarios: