29
/es/
es
AIzaSyAYiBZKx7MnpbEhh9jyipgxe19OcubqV5w
April 1, 2024
202045
Morocco
MAR
true
2
1
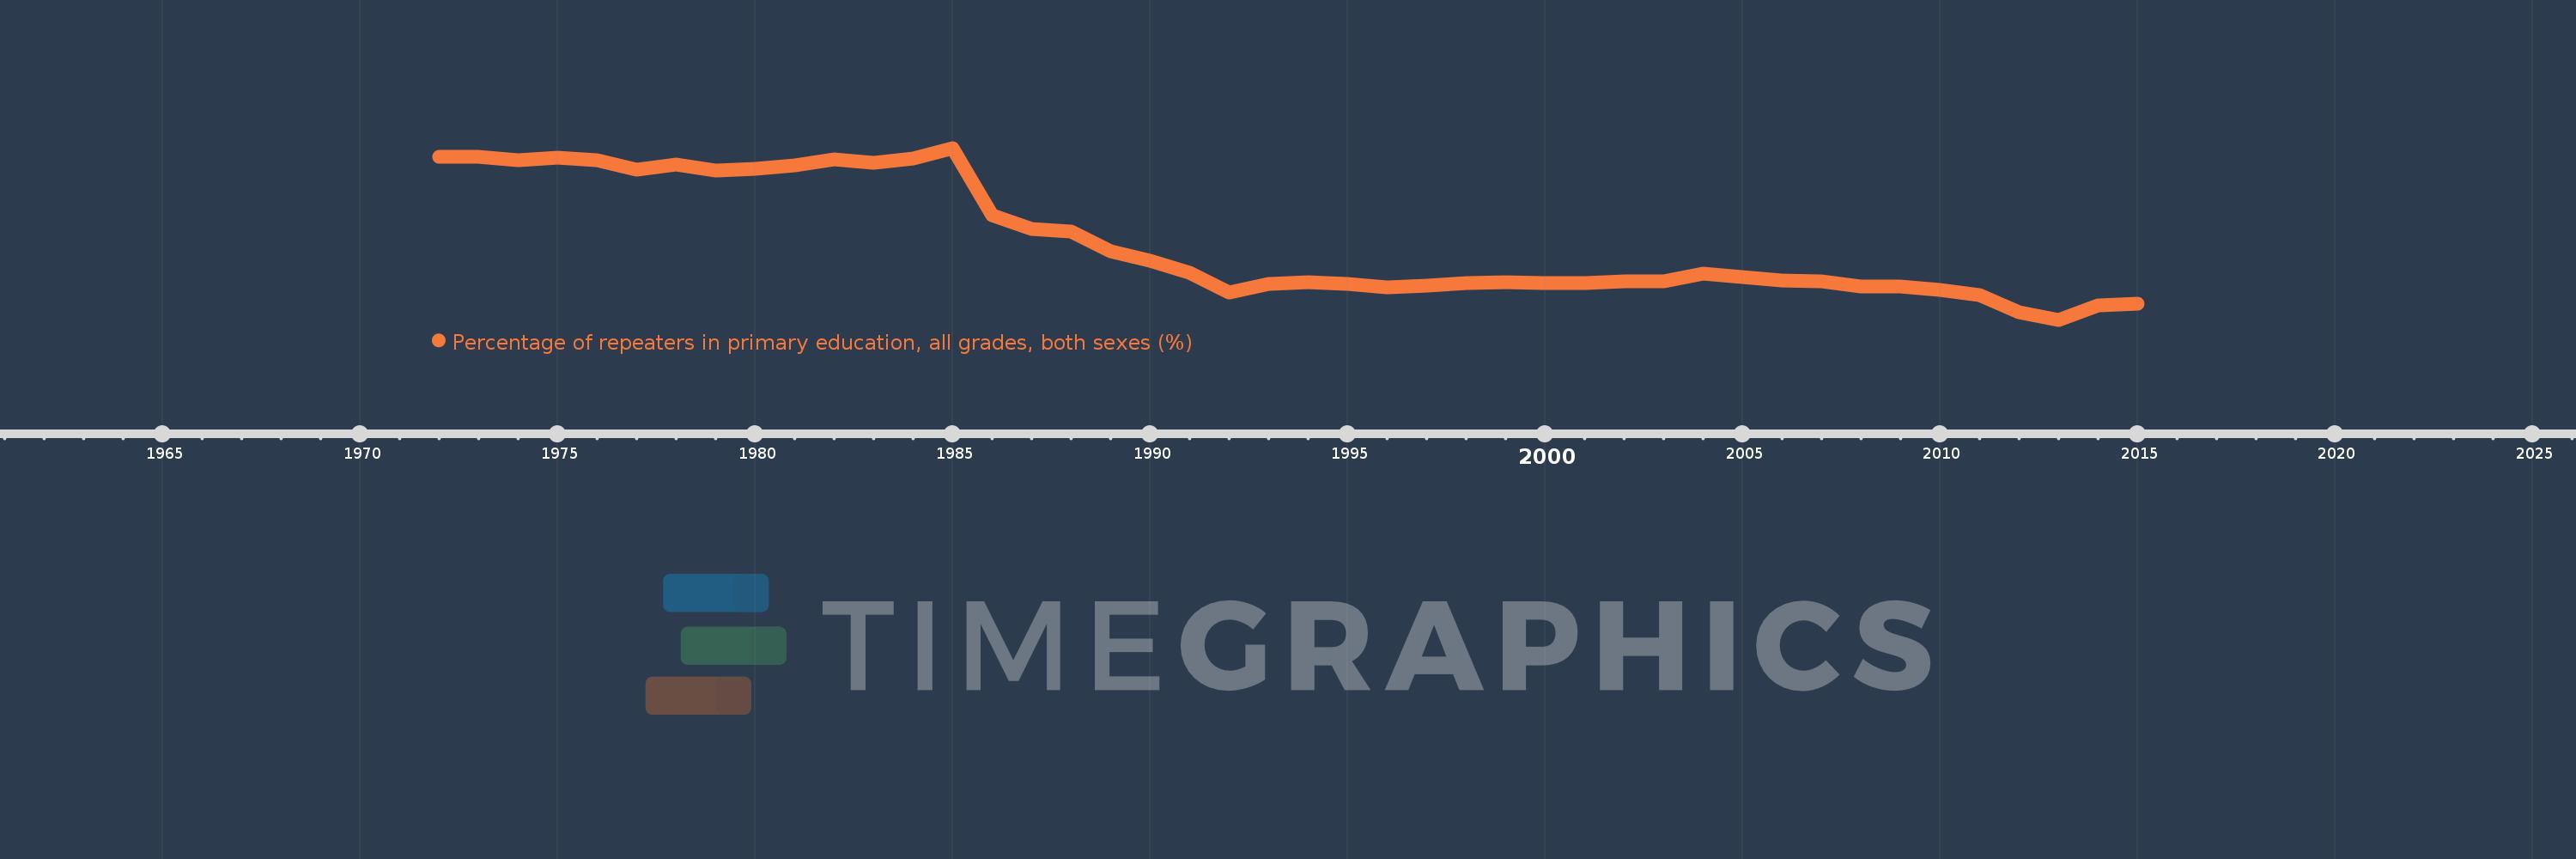
Percentage of repeaters in primary education, all grades, both sexes (%)
2015,2014,2013,2012,2011,2010,2009,2008,2007,2006,2005,2004,2003,2002,2001,2000,1999,1998,1997,1996,1995,1994,1993,1992,1991,1990,1989,1988,1987,1986,1985,1984,1983,1982,1981,1980,1979,1978,1977,1976,1975,1974,1973,1972
Estas estadísticas en otros países:
AfghanistanAlbaniaAlgeriaAndorraAngolaAntigua and BarbudaArab WorldArgentinaArmeniaArubaAustriaAzerbaijanBahamas, TheBahrainBangladeshBelarusBelgiumBelizeBeninBermudaBhutanBoliviaBosnia and HerzegovinaBotswanaBrazilBritish Virgin IslandsBrunei DarussalamBulgariaBurkina FasoBurundiCabo VerdeCambodiaCameroonCanadaCaribbean small statesCayman IslandsCentral African RepublicCentral Europe and the BalticsChadChileChinaColombiaComorosCongo, Dem. Rep.Congo, Rep.Costa RicaCote d'IvoireCroatiaCubaCyprusCzech RepublicDenmarkDjiboutiDominicaDominican RepublicEarly-demographic dividendEast Asia & PacificEast Asia & Pacific (excluding high income)East Asia & Pacific (IDA & IBRD countries)EcuadorEgypt, Arab Rep.El SalvadorEquatorial GuineaEritreaEstoniaEthiopiaEuro areaEurope & Central AsiaEurope & Central Asia (excluding high income)Europe & Central Asia (IDA & IBRD countries)European UnionFijiFinlandFragile and conflict affected situationsFranceGabonGambia, TheGeorgiaGermanyGhanaGreeceGrenadaGuatemalaGuineaGuinea-BissauGuyanaHaitiHeavily indebted poor countries (HIPC)High incomeHondurasHong Kong SAR, ChinaHungaryIBRD onlyIcelandIDA & IBRD totalIDA blendIDA onlyIDA totalIndiaIndonesiaIran, Islamic Rep.IraqIrelandIsraelItalyJamaicaJapanJordanKazakhstanKenyaKiribatiKorea, Rep.KuwaitKyrgyz RepublicLao PDRLate-demographic dividendLatin America & Caribbean Latin America & Caribbean (excluding high income)Latin America & the Caribbean (IDA & IBRD countries)LatviaLeast developed countries: UN classificationLebanonLesothoLiberiaLibyaLiechtensteinLithuaniaLow & middle incomeLow incomeLower middle incomeLuxembourgMacao SAR, ChinaMacedonia, FYRMadagascarMalawiMalaysiaMaldivesMaliMaltaMauritaniaMauritiusMexicoMiddle East & North AfricaMiddle East & North Africa (excluding high income)Middle East & North Africa (IDA & IBRD countries)Middle incomeMoldovaMonacoMongoliaMontenegroMoroccoMozambiqueMyanmarNamibiaNauruNepalNetherlandsNew ZealandNicaraguaNigerNorwayOECD membersOmanOther small statesPacific island small statesPakistanPalauPanamaPapua New GuineaParaguayPeruPhilippinesPolandPortugalPost-demographic dividendPre-demographic dividendQatarRomaniaRussian FederationRwandaSamoaSan MarinoSao Tome and PrincipeSaudi ArabiaSenegalSerbiaSeychellesSierra LeoneSingaporeSint Maarten (Dutch part)Slovak RepublicSloveniaSmall statesSolomon IslandsSomaliaSouth AfricaSouth AsiaSouth Asia (IDA & IBRD)South SudanSpainSri LankaSt. Kitts and NevisSt. LuciaSt. Vincent and the GrenadinesSub-Saharan Africa Sub-Saharan Africa (excluding high income)Sub-Saharan Africa (IDA & IBRD countries)SudanSurinameSwazilandSwedenSwitzerlandSyrian Arab RepublicTajikistanTanzaniaThailandTimor-LesteTogoTongaTrinidad and TobagoTunisiaTurkeyTurks and Caicos IslandsTuvaluUgandaUkraineUnited Arab EmiratesUnited KingdomUpper middle incomeUruguayUzbekistanVanuatuVenezuela, RBVietnamWest Bank and GazaWorldYemen, Rep.ZambiaZimbabwe línea de tiempo (timeline):
En esta escala de tiempo se presenta un gráfico de 1972 y 2015 de Morocco. Los datos de 1971 están ausentes. El número de observaciones reales por fecha: 44.
Fuente (nombre):
Indicadores del desarrollo mundial
Fuente (organización):
UNESCO Institute for Statistics
Categorías:
Education
Se ha actualizado:
23 abr 2017 año
Los indicadores de los cambios de valor en los últimos años
Mínimo:
7.281
1 ene 2013 año
Máximo:
31.044
1 ene 1985 año
A la fecha de observación
Valor
Cambio absoluto
El cambio con respecto al valor anterior
1 ene 1972 año
29.787
+29.787
0.0%
1 ene 1973 año
29.851
+0.064
0.21%
1 ene 1974 año
29.303
-0.548
-1.83%
1 ene 1975 año
29.653
+0.35
1.2%
1 ene 1976 año
29.382
-0.272
-0.92%
1 ene 1977 año
28.068
-1.314
-4.47%
1 ene 1978 año
28.696
+0.628
2.24%
1 ene 1979 año
27.862
-0.834
-2.91%
1 ene 1980 año
28.16
+0.299
1.07%
1 ene 1981 año
28.634
+0.474
1.68%
1 ene 1982 año
29.453
+0.819
2.86%
1 ene 1983 año
29.003
-0.451
-1.53%
1 ene 1984 año
29.559
+0.556
1.92%
1 ene 1985 año
31.044
+1.486
5.03%
1 ene 1986 año
21.726
-9.319
-30.02%
1 ene 1987 año
19.816
-1.91
-8.79%
1 ene 1988 año
19.426
-0.39
-1.97%
1 ene 1989 año
16.755
-2.671
-13.75%
1 ene 1990 año
15.473
-1.282
-7.65%
1 ene 1991 año
13.724
-1.748
-11.3%
1 ene 1992 año
11.074
-2.651
-19.31%
1 ene 1993 año
12.273
+1.199
10.83%
1 ene 1994 año
12.418
+0.144
1.18%
1 ene 1995 año
12.27
-0.147
-1.19%
1 ene 1996 año
11.748
-0.522
-4.26%
1 ene 1997 año
11.999
+0.251
2.14%
1 ene 1998 año
12.339
+0.34
2.83%
1 ene 1999 año
12.486
+0.147
1.19%
1 ene 2000 año
12.397
-0.089
-0.72%
1 ene 2001 año
12.347
-0.05
-0.4%
1 ene 2002 año
12.651
+0.304
2.46%
1 ene 2003 año
12.604
-0.047
-0.37%
1 ene 2004 año
13.665
+1.06
8.41%
1 ene 2005 año
13.218
-0.447
-3.27%
1 ene 2006 año
12.725
-0.492
-3.73%
1 ene 2007 año
12.562
-0.163
-1.28%
1 ene 2008 año
11.878
-0.684
-5.45%
1 ene 2009 año
11.887
+0.01
0.08%
1 ene 2010 año
11.438
-0.45
-3.78%
1 ene 2011 año
10.746
-0.692
-6.05%
1 ene 2012 año
8.294
-2.452
-22.81%
1 ene 2013 año
7.281
-1.013
-12.21%
1 ene 2014 año
9.23
+1.948
26.76%
1 ene 2015 año
9.553
+0.324
3.51%
Ranking de los países por los datos estadísticos actuales


Comentarios: