29
/es/
es
AIzaSyAYiBZKx7MnpbEhh9jyipgxe19OcubqV5w
April 1, 2024
193451
Mauritania
MRT
true
2
1
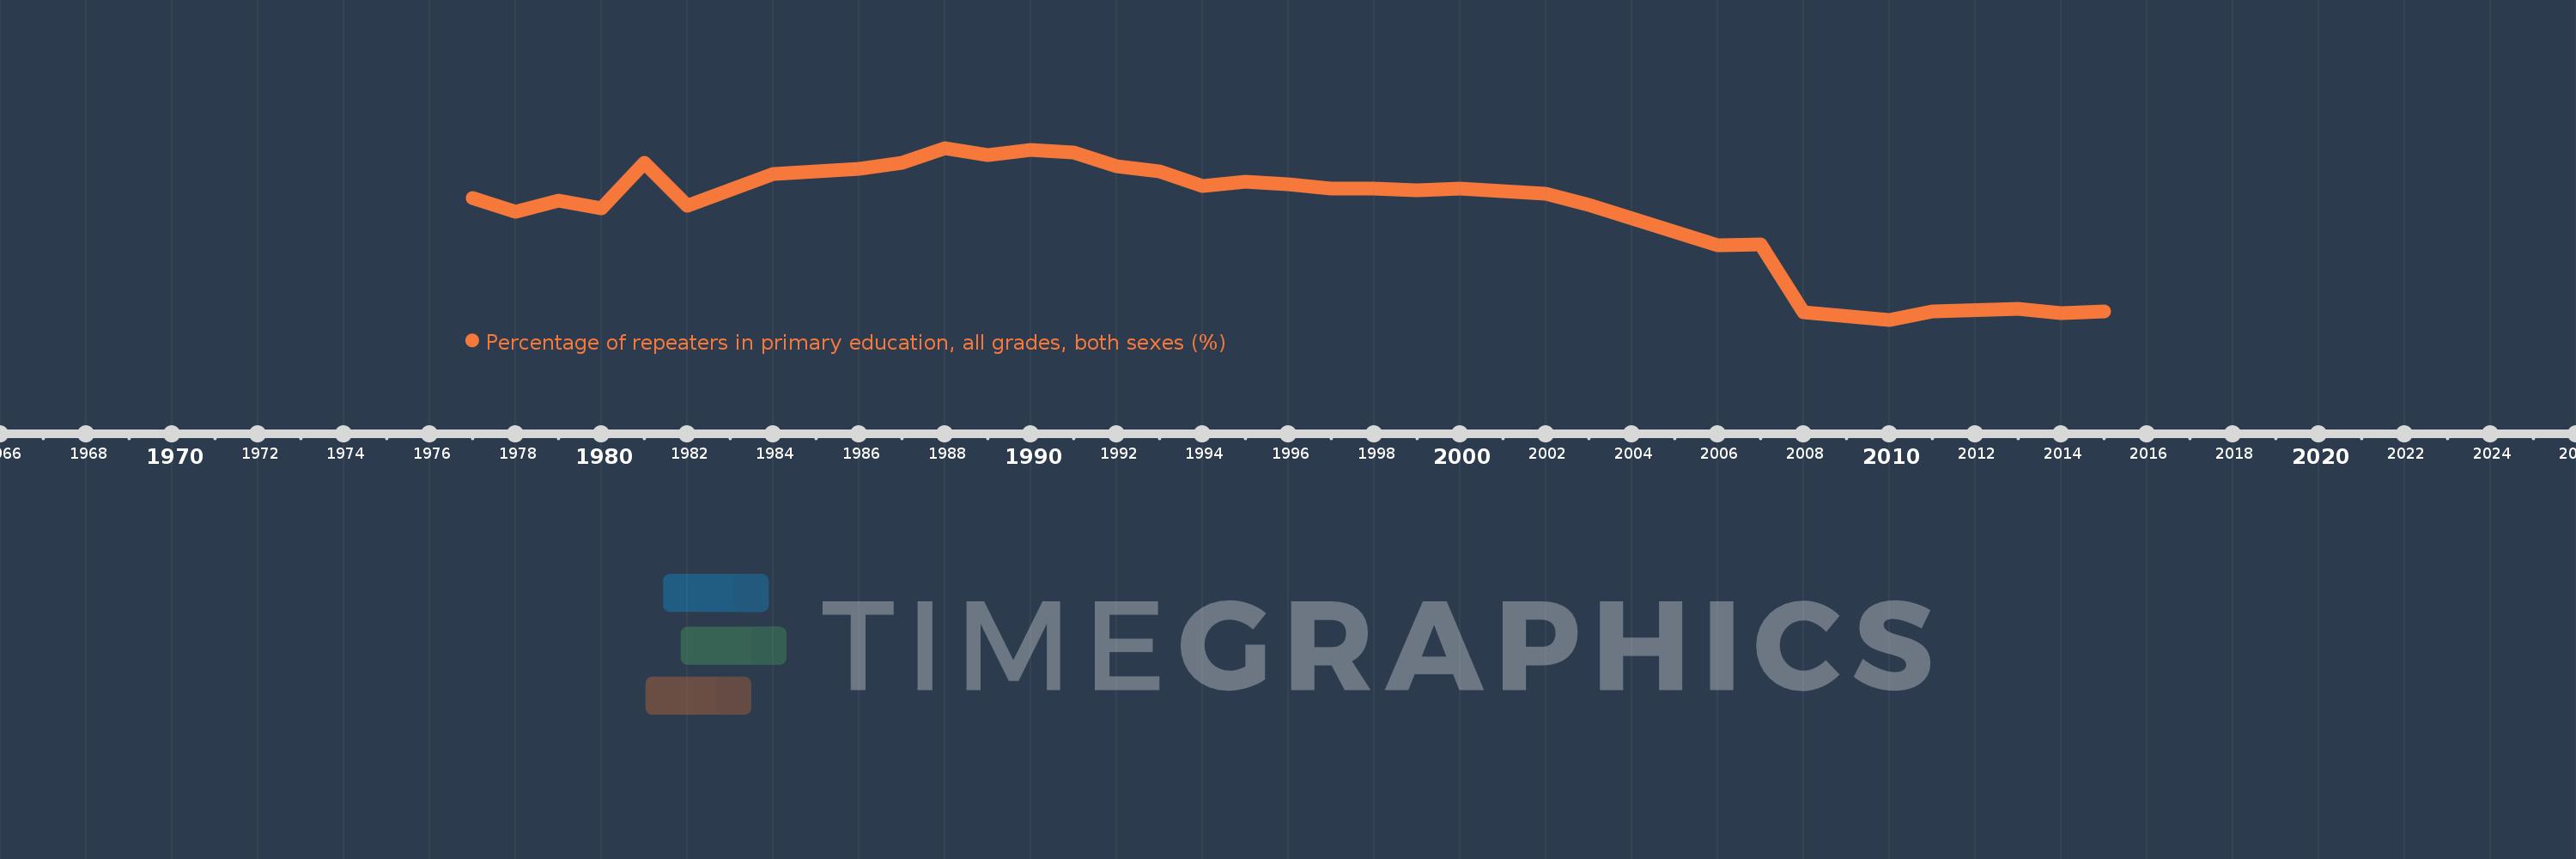
Percentage of repeaters in primary education, all grades, both sexes (%)
2015,2014,2013,2011,2010,2008,2007,2006,2003,2002,2000,1999,1998,1997,1996,1995,1994,1993,1992,1991,1990,1989,1988,1987,1986,1984,1982,1981,1980,1979,1978,1977
Estas estadísticas en otros países:
AfghanistanAlbaniaAlgeriaAndorraAngolaAntigua and BarbudaArab WorldArgentinaArmeniaArubaAustriaAzerbaijanBahamas, TheBahrainBangladeshBelarusBelgiumBelizeBeninBermudaBhutanBoliviaBosnia and HerzegovinaBotswanaBrazilBritish Virgin IslandsBrunei DarussalamBulgariaBurkina FasoBurundiCabo VerdeCambodiaCameroonCanadaCaribbean small statesCayman IslandsCentral African RepublicCentral Europe and the BalticsChadChileChinaColombiaComorosCongo, Dem. Rep.Congo, Rep.Costa RicaCote d'IvoireCroatiaCubaCyprusCzech RepublicDenmarkDjiboutiDominicaDominican RepublicEarly-demographic dividendEast Asia & PacificEast Asia & Pacific (excluding high income)East Asia & Pacific (IDA & IBRD countries)EcuadorEgypt, Arab Rep.El SalvadorEquatorial GuineaEritreaEstoniaEthiopiaEuro areaEurope & Central AsiaEurope & Central Asia (excluding high income)Europe & Central Asia (IDA & IBRD countries)European UnionFijiFinlandFragile and conflict affected situationsFranceGabonGambia, TheGeorgiaGermanyGhanaGreeceGrenadaGuatemalaGuineaGuinea-BissauGuyanaHaitiHeavily indebted poor countries (HIPC)High incomeHondurasHong Kong SAR, ChinaHungaryIBRD onlyIcelandIDA & IBRD totalIDA blendIDA onlyIDA totalIndiaIndonesiaIran, Islamic Rep.IraqIrelandIsraelItalyJamaicaJapanJordanKazakhstanKenyaKiribatiKorea, Rep.KuwaitKyrgyz RepublicLao PDRLate-demographic dividendLatin America & Caribbean Latin America & Caribbean (excluding high income)Latin America & the Caribbean (IDA & IBRD countries)LatviaLeast developed countries: UN classificationLebanonLesothoLiberiaLibyaLiechtensteinLithuaniaLow & middle incomeLow incomeLower middle incomeLuxembourgMacao SAR, ChinaMacedonia, FYRMadagascarMalawiMalaysiaMaldivesMaliMaltaMauritaniaMauritiusMexicoMiddle East & North AfricaMiddle East & North Africa (excluding high income)Middle East & North Africa (IDA & IBRD countries)Middle incomeMoldovaMonacoMongoliaMontenegroMoroccoMozambiqueMyanmarNamibiaNauruNepalNetherlandsNew ZealandNicaraguaNigerNorwayOECD membersOmanOther small statesPacific island small statesPakistanPalauPanamaPapua New GuineaParaguayPeruPhilippinesPolandPortugalPost-demographic dividendPre-demographic dividendQatarRomaniaRussian FederationRwandaSamoaSan MarinoSao Tome and PrincipeSaudi ArabiaSenegalSerbiaSeychellesSierra LeoneSingaporeSint Maarten (Dutch part)Slovak RepublicSloveniaSmall statesSolomon IslandsSomaliaSouth AfricaSouth AsiaSouth Asia (IDA & IBRD)South SudanSpainSri LankaSt. Kitts and NevisSt. LuciaSt. Vincent and the GrenadinesSub-Saharan Africa Sub-Saharan Africa (excluding high income)Sub-Saharan Africa (IDA & IBRD countries)SudanSurinameSwazilandSwedenSwitzerlandSyrian Arab RepublicTajikistanTanzaniaThailandTimor-LesteTogoTongaTrinidad and TobagoTunisiaTurkeyTurks and Caicos IslandsTuvaluUgandaUkraineUnited Arab EmiratesUnited KingdomUpper middle incomeUruguayUzbekistanVanuatuVenezuela, RBVietnamWest Bank and GazaWorldYemen, Rep.ZambiaZimbabwe línea de tiempo (timeline):
En esta escala de tiempo se presenta un gráfico de 1977 y 2015 de Mauritania. Los datos de 1976 están ausentes. El número de observaciones reales por fecha: 32.
Fuente (nombre):
Indicadores del desarrollo mundial
Fuente (organización):
UNESCO Institute for Statistics
Categorías:
Education
Se ha actualizado:
23 abr 2017 año
Los indicadores de los cambios de valor en los últimos años
Mínimo:
2.646
1 ene 2010 año
Máximo:
19.782
1 ene 1988 año
A la fecha de observación
Valor
Cambio absoluto
El cambio con respecto al valor anterior
1 ene 1977 año
14.783
+14.783
0.0%
1 ene 1978 año
13.442
-1.341
-9.07%
1 ene 1979 año
14.505
+1.063
7.91%
1 ene 1980 año
13.738
-0.767
-5.29%
1 ene 1981 año
18.273
+4.536
33.02%
1 ene 1982 año
14.01
-4.264
-23.33%
1 ene 1984 año
17.189
+3.179
22.69%
1 ene 1986 año
17.705
+0.517
3.01%
1 ene 1987 año
18.332
+0.626
3.54%
1 ene 1988 año
19.782
+1.45
7.91%
1 ene 1989 año
19.082
-0.699
-3.54%
1 ene 1990 año
19.557
+0.475
2.49%
1 ene 1991 año
19.337
-0.22
-1.13%
1 ene 1992 año
17.953
-1.384
-7.16%
1 ene 1993 año
17.483
-0.47
-2.62%
1 ene 1994 año
16.017
-1.466
-8.38%
1 ene 1995 año
16.45
+0.432
2.7%
1 ene 1996 año
16.127
-0.322
-1.96%
1 ene 1997 año
15.747
-0.38
-2.36%
1 ene 1998 año
15.768
+0.021
0.13%
1 ene 1999 año
15.577
-0.191
-1.21%
1 ene 2000 año
15.752
+0.175
1.13%
1 ene 2002 año
15.221
-0.531
-3.37%
1 ene 2003 año
14.086
-1.135
-7.46%
1 ene 2006 año
10.1
-3.986
-28.3%
1 ene 2007 año
10.18
+0.08
0.79%
1 ene 2008 año
3.401
-6.78
-66.59%
1 ene 2010 año
2.646
-0.755
-22.19%
1 ene 2011 año
3.456
+0.81
30.6%
1 ene 2013 año
3.709
+0.253
7.33%
1 ene 2014 año
3.344
-0.365
-9.85%
1 ene 2015 año
3.488
+0.145
4.32%
Ranking de los países por los datos estadísticos actuales


Comentarios: