29
/es/
es
AIzaSyAYiBZKx7MnpbEhh9jyipgxe19OcubqV5w
April 1, 2024
51274
Middle income
MIC
false
2
1
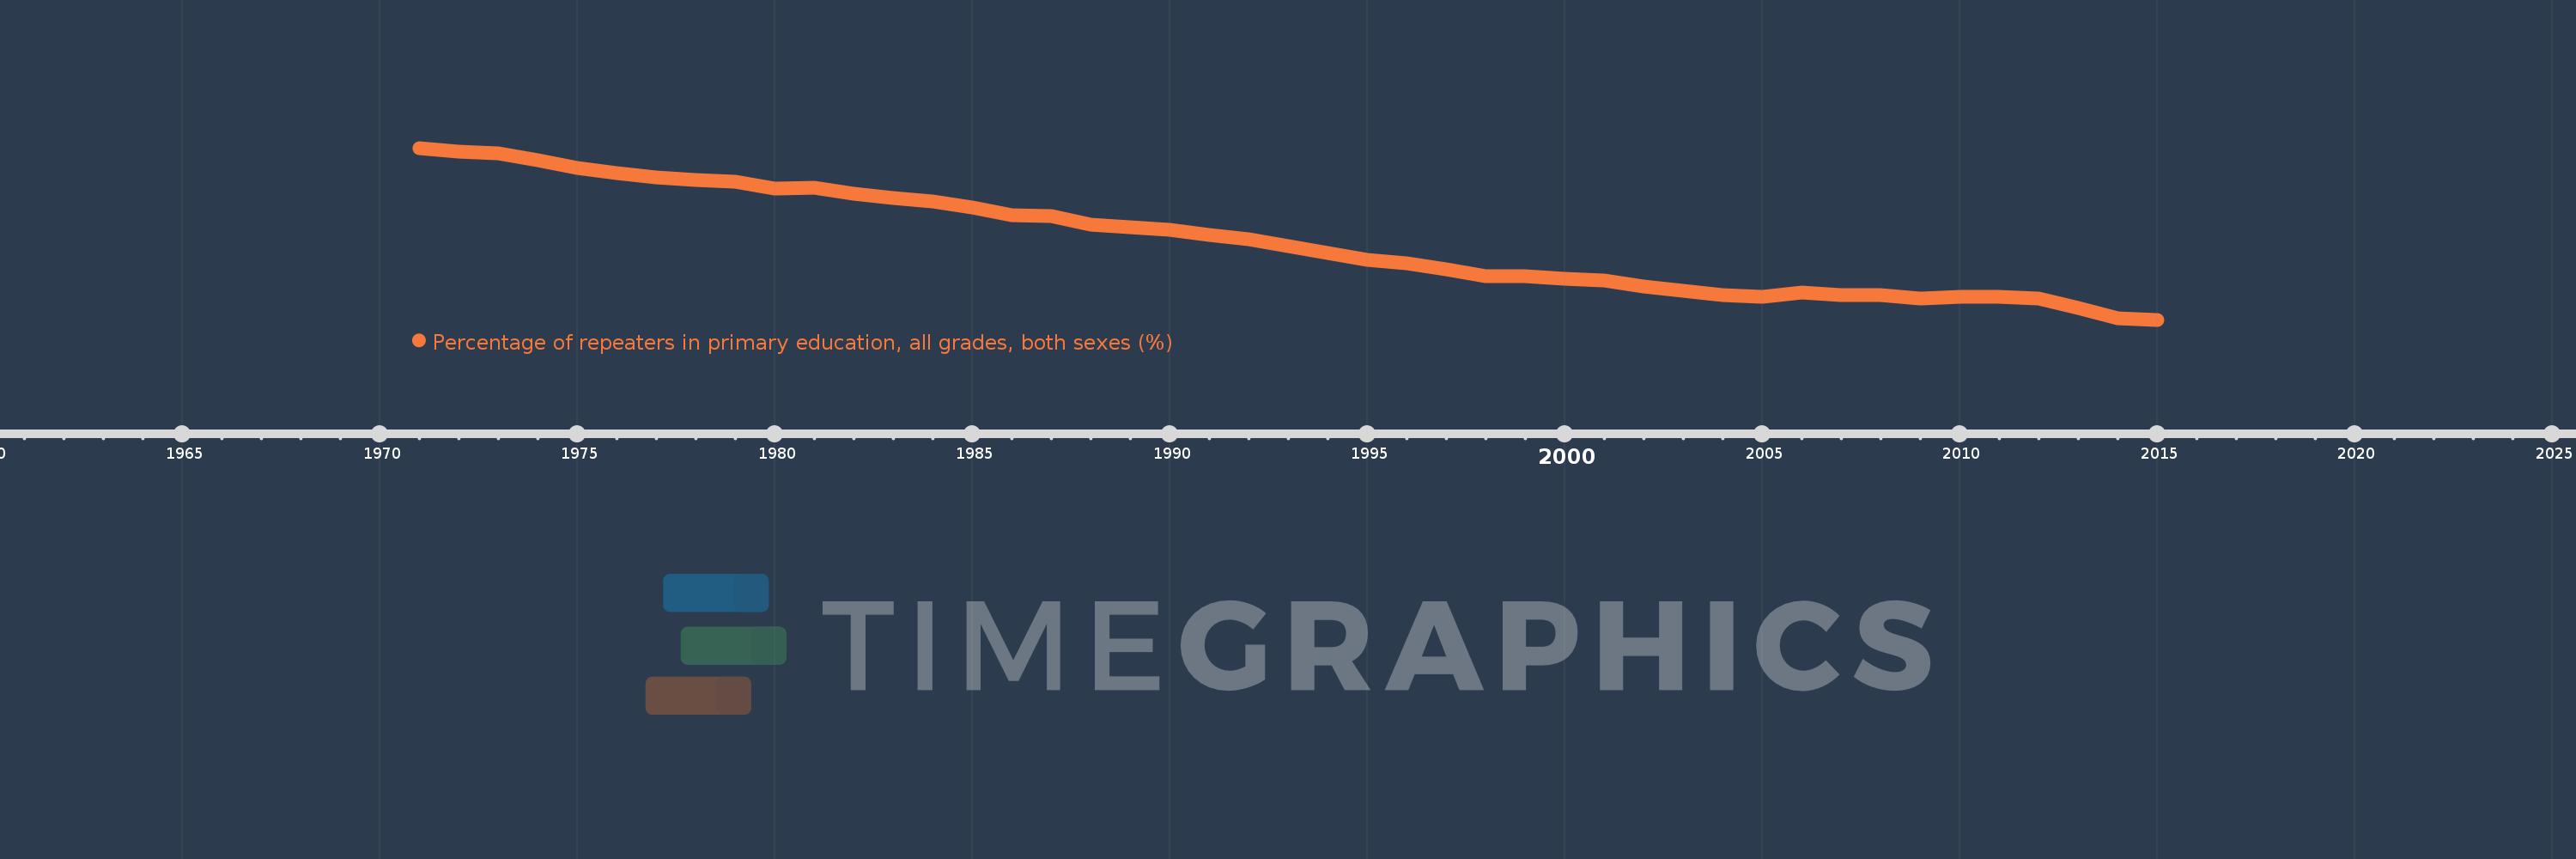
Percentage of repeaters in primary education, all grades, both sexes (%)
2015,2014,2013,2012,2011,2010,2009,2008,2007,2006,2005,2004,2003,2002,2001,2000,1999,1998,1997,1996,1995,1994,1993,1992,1991,1990,1989,1988,1987,1986,1985,1984,1983,1982,1981,1980,1979,1978,1977,1976,1975,1974,1973,1972,1971
Estas estadísticas en otros países:
AfghanistanAlbaniaAlgeriaAndorraAngolaAntigua and BarbudaArab WorldArgentinaArmeniaArubaAustriaAzerbaijanBahamas, TheBahrainBangladeshBelarusBelgiumBelizeBeninBermudaBhutanBoliviaBosnia and HerzegovinaBotswanaBrazilBritish Virgin IslandsBrunei DarussalamBulgariaBurkina FasoBurundiCabo VerdeCambodiaCameroonCanadaCaribbean small statesCayman IslandsCentral African RepublicCentral Europe and the BalticsChadChileChinaColombiaComorosCongo, Dem. Rep.Congo, Rep.Costa RicaCote d'IvoireCroatiaCubaCyprusCzech RepublicDenmarkDjiboutiDominicaDominican RepublicEarly-demographic dividendEast Asia & PacificEast Asia & Pacific (excluding high income)East Asia & Pacific (IDA & IBRD countries)EcuadorEgypt, Arab Rep.El SalvadorEquatorial GuineaEritreaEstoniaEthiopiaEuro areaEurope & Central AsiaEurope & Central Asia (excluding high income)Europe & Central Asia (IDA & IBRD countries)European UnionFijiFinlandFragile and conflict affected situationsFranceGabonGambia, TheGeorgiaGermanyGhanaGreeceGrenadaGuatemalaGuineaGuinea-BissauGuyanaHaitiHeavily indebted poor countries (HIPC)High incomeHondurasHong Kong SAR, ChinaHungaryIBRD onlyIcelandIDA & IBRD totalIDA blendIDA onlyIDA totalIndiaIndonesiaIran, Islamic Rep.IraqIrelandIsraelItalyJamaicaJapanJordanKazakhstanKenyaKiribatiKorea, Rep.KuwaitKyrgyz RepublicLao PDRLate-demographic dividendLatin America & Caribbean Latin America & Caribbean (excluding high income)Latin America & the Caribbean (IDA & IBRD countries)LatviaLeast developed countries: UN classificationLebanonLesothoLiberiaLibyaLiechtensteinLithuaniaLow & middle incomeLow incomeLower middle incomeLuxembourgMacao SAR, ChinaMacedonia, FYRMadagascarMalawiMalaysiaMaldivesMaliMaltaMauritaniaMauritiusMexicoMiddle East & North AfricaMiddle East & North Africa (excluding high income)Middle East & North Africa (IDA & IBRD countries)Middle incomeMoldovaMonacoMongoliaMontenegroMoroccoMozambiqueMyanmarNamibiaNauruNepalNetherlandsNew ZealandNicaraguaNigerNorwayOECD membersOmanOther small statesPacific island small statesPakistanPalauPanamaPapua New GuineaParaguayPeruPhilippinesPolandPortugalPost-demographic dividendPre-demographic dividendQatarRomaniaRussian FederationRwandaSamoaSan MarinoSao Tome and PrincipeSaudi ArabiaSenegalSerbiaSeychellesSierra LeoneSingaporeSint Maarten (Dutch part)Slovak RepublicSloveniaSmall statesSolomon IslandsSomaliaSouth AfricaSouth AsiaSouth Asia (IDA & IBRD)South SudanSpainSri LankaSt. Kitts and NevisSt. LuciaSt. Vincent and the GrenadinesSub-Saharan Africa Sub-Saharan Africa (excluding high income)Sub-Saharan Africa (IDA & IBRD countries)SudanSurinameSwazilandSwedenSwitzerlandSyrian Arab RepublicTajikistanTanzaniaThailandTimor-LesteTogoTongaTrinidad and TobagoTunisiaTurkeyTurks and Caicos IslandsTuvaluUgandaUkraineUnited Arab EmiratesUnited KingdomUpper middle incomeUruguayUzbekistanVanuatuVenezuela, RBVietnamWest Bank and GazaWorldYemen, Rep.ZambiaZimbabwe línea de tiempo (timeline):
En esta escala de tiempo se presenta un gráfico de 1971 y 2015 de Middle income. Los datos de 1970 están ausentes. El número de observaciones reales por fecha: 45.
Fuente (nombre):
Indicadores del desarrollo mundial
Fuente (organización):
UNESCO Institute for Statistics
Categorías:
Education
Se ha actualizado:
23 abr 2017 año
Los indicadores de los cambios de valor en los últimos años
Mínimo:
2.885
1 ene 2015 año
Máximo:
11.374
1 ene 1971 año
A la fecha de observación
Valor
Cambio absoluto
El cambio con respecto al valor anterior
1 ene 1971 año
11.374
+11.374
0.0%
1 ene 1972 año
11.201
-0.173
-1.52%
1 ene 1973 año
11.098
-0.103
-0.92%
1 ene 1974 año
10.754
-0.344
-3.1%
1 ene 1975 año
10.401
-0.353
-3.28%
1 ene 1976 año
10.126
-0.275
-2.64%
1 ene 1977 año
9.928
-0.198
-1.96%
1 ene 1978 año
9.78
-0.148
-1.49%
1 ene 1979 año
9.699
-0.08
-0.82%
1 ene 1980 año
9.382
-0.317
-3.27%
1 ene 1981 año
9.389
+0.006
0.07%
1 ene 1982 año
9.111
-0.277
-2.95%
1 ene 1983 año
8.917
-0.195
-2.14%
1 ene 1984 año
8.711
-0.205
-2.3%
1 ene 1985 año
8.426
-0.285
-3.27%
1 ene 1986 año
8.061
-0.365
-4.33%
1 ene 1987 año
7.992
-0.069
-0.85%
1 ene 1988 año
7.574
-0.418
-5.24%
1 ene 1989 año
7.471
-0.103
-1.36%
1 ene 1990 año
7.345
-0.126
-1.69%
1 ene 1991 año
7.071
-0.273
-3.72%
1 ene 1992 año
6.859
-0.212
-3.0%
1 ene 1993 año
6.505
-0.354
-5.16%
1 ene 1994 año
6.171
-0.334
-5.13%
1 ene 1995 año
5.854
-0.317
-5.14%
1 ene 1996 año
5.658
-0.197
-3.36%
1 ene 1997 año
5.367
-0.291
-5.14%
1 ene 1998 año
5.043
-0.324
-6.03%
1 ene 1999 año
5.02
-0.023
-0.45%
1 ene 2000 año
4.899
-0.121
-2.41%
1 ene 2001 año
4.833
-0.066
-1.36%
1 ene 2002 año
4.51
-0.323
-6.68%
1 ene 2003 año
4.334
-0.176
-3.9%
1 ene 2004 año
4.095
-0.239
-5.52%
1 ene 2005 año
4.036
-0.059
-1.44%
1 ene 2006 año
4.212
+0.176
4.36%
1 ene 2007 año
4.104
-0.108
-2.56%
1 ene 2008 año
4.101
-0.003
-0.08%
1 ene 2009 año
3.941
-0.16
-3.89%
1 ene 2010 año
4.036
+0.094
2.4%
1 ene 2011 año
4.012
-0.023
-0.57%
1 ene 2012 año
3.943
-0.069
-1.72%
1 ene 2013 año
3.479
-0.465
-11.78%
1 ene 2014 año
2.959
-0.519
-14.93%
1 ene 2015 año
2.885
-0.074
-2.52%
Ranking de los países por los datos estadísticos actuales


Comentarios: