29
/es/
es
AIzaSyAYiBZKx7MnpbEhh9jyipgxe19OcubqV5w
April 1, 2024
90250
Botswana
BWA
true
2
1
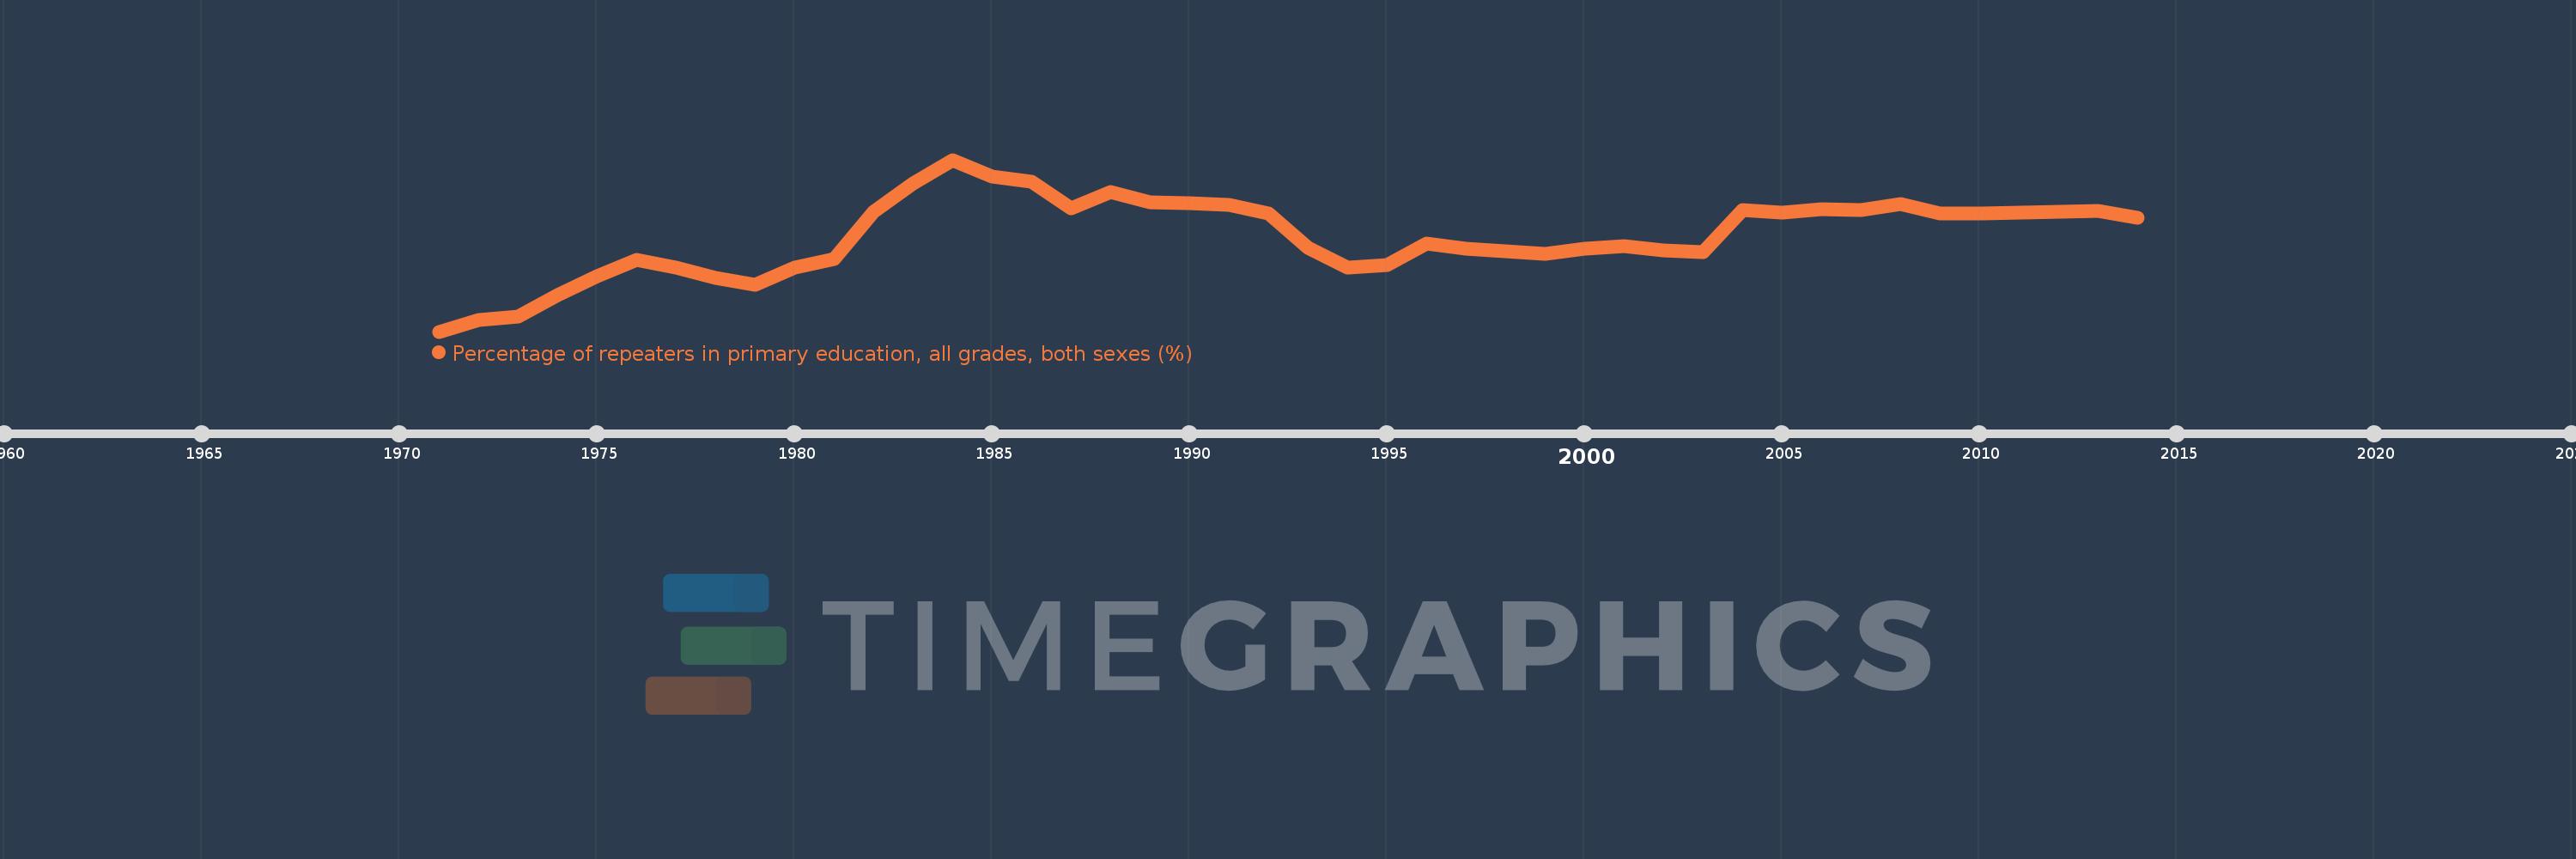
Percentage of repeaters in primary education, all grades, both sexes (%)
2014,2013,2010,2009,2008,2007,2006,2005,2004,2003,2002,2001,2000,1999,1997,1996,1995,1994,1993,1992,1991,1990,1989,1988,1987,1986,1985,1984,1983,1982,1981,1980,1979,1978,1977,1976,1975,1974,1973,1972,1971
Estas estadísticas en otros países:
AfghanistanAlbaniaAlgeriaAndorraAngolaAntigua and BarbudaArab WorldArgentinaArmeniaArubaAustriaAzerbaijanBahamas, TheBahrainBangladeshBelarusBelgiumBelizeBeninBermudaBhutanBoliviaBosnia and HerzegovinaBotswanaBrazilBritish Virgin IslandsBrunei DarussalamBulgariaBurkina FasoBurundiCabo VerdeCambodiaCameroonCanadaCaribbean small statesCayman IslandsCentral African RepublicCentral Europe and the BalticsChadChileChinaColombiaComorosCongo, Dem. Rep.Congo, Rep.Costa RicaCote d'IvoireCroatiaCubaCyprusCzech RepublicDenmarkDjiboutiDominicaDominican RepublicEarly-demographic dividendEast Asia & PacificEast Asia & Pacific (excluding high income)East Asia & Pacific (IDA & IBRD countries)EcuadorEgypt, Arab Rep.El SalvadorEquatorial GuineaEritreaEstoniaEthiopiaEuro areaEurope & Central AsiaEurope & Central Asia (excluding high income)Europe & Central Asia (IDA & IBRD countries)European UnionFijiFinlandFragile and conflict affected situationsFranceGabonGambia, TheGeorgiaGermanyGhanaGreeceGrenadaGuatemalaGuineaGuinea-BissauGuyanaHaitiHeavily indebted poor countries (HIPC)High incomeHondurasHong Kong SAR, ChinaHungaryIBRD onlyIcelandIDA & IBRD totalIDA blendIDA onlyIDA totalIndiaIndonesiaIran, Islamic Rep.IraqIrelandIsraelItalyJamaicaJapanJordanKazakhstanKenyaKiribatiKorea, Rep.KuwaitKyrgyz RepublicLao PDRLate-demographic dividendLatin America & Caribbean Latin America & Caribbean (excluding high income)Latin America & the Caribbean (IDA & IBRD countries)LatviaLeast developed countries: UN classificationLebanonLesothoLiberiaLibyaLiechtensteinLithuaniaLow & middle incomeLow incomeLower middle incomeLuxembourgMacao SAR, ChinaMacedonia, FYRMadagascarMalawiMalaysiaMaldivesMaliMaltaMauritaniaMauritiusMexicoMiddle East & North AfricaMiddle East & North Africa (excluding high income)Middle East & North Africa (IDA & IBRD countries)Middle incomeMoldovaMonacoMongoliaMontenegroMoroccoMozambiqueMyanmarNamibiaNauruNepalNetherlandsNew ZealandNicaraguaNigerNorwayOECD membersOmanOther small statesPacific island small statesPakistanPalauPanamaPapua New GuineaParaguayPeruPhilippinesPolandPortugalPost-demographic dividendPre-demographic dividendQatarRomaniaRussian FederationRwandaSamoaSan MarinoSao Tome and PrincipeSaudi ArabiaSenegalSerbiaSeychellesSierra LeoneSingaporeSint Maarten (Dutch part)Slovak RepublicSloveniaSmall statesSolomon IslandsSomaliaSouth AfricaSouth AsiaSouth Asia (IDA & IBRD)South SudanSpainSri LankaSt. Kitts and NevisSt. LuciaSt. Vincent and the GrenadinesSub-Saharan Africa Sub-Saharan Africa (excluding high income)Sub-Saharan Africa (IDA & IBRD countries)SudanSurinameSwazilandSwedenSwitzerlandSyrian Arab RepublicTajikistanTanzaniaThailandTimor-LesteTogoTongaTrinidad and TobagoTunisiaTurkeyTurks and Caicos IslandsTuvaluUgandaUkraineUnited Arab EmiratesUnited KingdomUpper middle incomeUruguayUzbekistanVanuatuVenezuela, RBVietnamWest Bank and GazaWorldYemen, Rep.ZambiaZimbabwe línea de tiempo (timeline):
En esta escala de tiempo se presenta un gráfico de 1971 y 2014 de Botswana. Los datos de 1970 están ausentes. El número de observaciones reales por fecha: 41.
Fuente (nombre):
Indicadores del desarrollo mundial
Fuente (organización):
UNESCO Institute for Statistics
Categorías:
Education
Se ha actualizado:
23 abr 2017 año
Los indicadores de los cambios de valor en los últimos años
Mínimo:
0.333
1 ene 1971 año
Máximo:
6.475
1 ene 1984 año
A la fecha de observación
Valor
Cambio absoluto
El cambio con respecto al valor anterior
1 ene 1971 año
0.333
+0.333
0.0%
1 ene 1972 año
0.734
+0.402
120.83%
1 ene 1973 año
0.882
+0.147
20.07%
1 ene 1974 año
1.645
+0.763
86.56%
1 ene 1975 año
2.305
+0.661
40.16%
1 ene 1976 año
2.89
+0.585
25.36%
1 ene 1977 año
2.613
-0.277
-9.58%
1 ene 1978 año
2.257
-0.356
-13.62%
1 ene 1979 año
2.0
-0.257
-11.4%
1 ene 1980 año
2.63
+0.631
31.53%
1 ene 1981 año
2.932
+0.301
11.45%
1 ene 1982 año
4.628
+1.696
57.85%
1 ene 1983 año
5.635
+1.008
21.78%
1 ene 1984 año
6.475
+0.839
14.89%
1 ene 1985 año
5.881
-0.593
-9.17%
1 ene 1986 año
5.685
-0.196
-3.33%
1 ene 1987 año
4.731
-0.955
-16.79%
1 ene 1988 año
5.312
+0.581
12.28%
1 ene 1989 año
4.95
-0.362
-6.81%
1 ene 1990 año
4.935
-0.015
-0.29%
1 ene 1991 año
4.875
-0.06
-1.22%
1 ene 1992 año
4.561
-0.314
-6.44%
1 ene 1993 año
3.319
-1.242
-27.24%
1 ene 1994 año
2.614
-0.705
-21.24%
1 ene 1995 año
2.704
+0.091
3.47%
1 ene 1996 año
3.477
+0.772
28.56%
1 ene 1997 año
3.288
-0.189
-5.44%
1 ene 1999 año
3.098
-0.189
-5.76%
1 ene 2000 año
3.309
+0.211
6.81%
1 ene 2001 año
3.396
+0.087
2.62%
1 ene 2002 año
3.242
-0.154
-4.54%
1 ene 2003 año
3.189
-0.053
-1.62%
1 ene 2004 año
4.689
+1.499
47.01%
1 ene 2005 año
4.598
-0.091
-1.94%
1 ene 2006 año
4.709
+0.111
2.42%
1 ene 2007 año
4.667
-0.041
-0.88%
1 ene 2008 año
4.893
+0.226
4.84%
1 ene 2009 año
4.553
-0.34
-6.95%
1 ene 2010 año
4.554
+0.001
0.01%
1 ene 2013 año
4.662
+0.109
2.39%
1 ene 2014 año
4.394
-0.269
-5.77%
Ranking de los países por los datos estadísticos actuales


Comentarios: