29
/es/
es
AIzaSyAYiBZKx7MnpbEhh9jyipgxe19OcubqV5w
April 1, 2024
265049
Togo
TGO
true
2
1
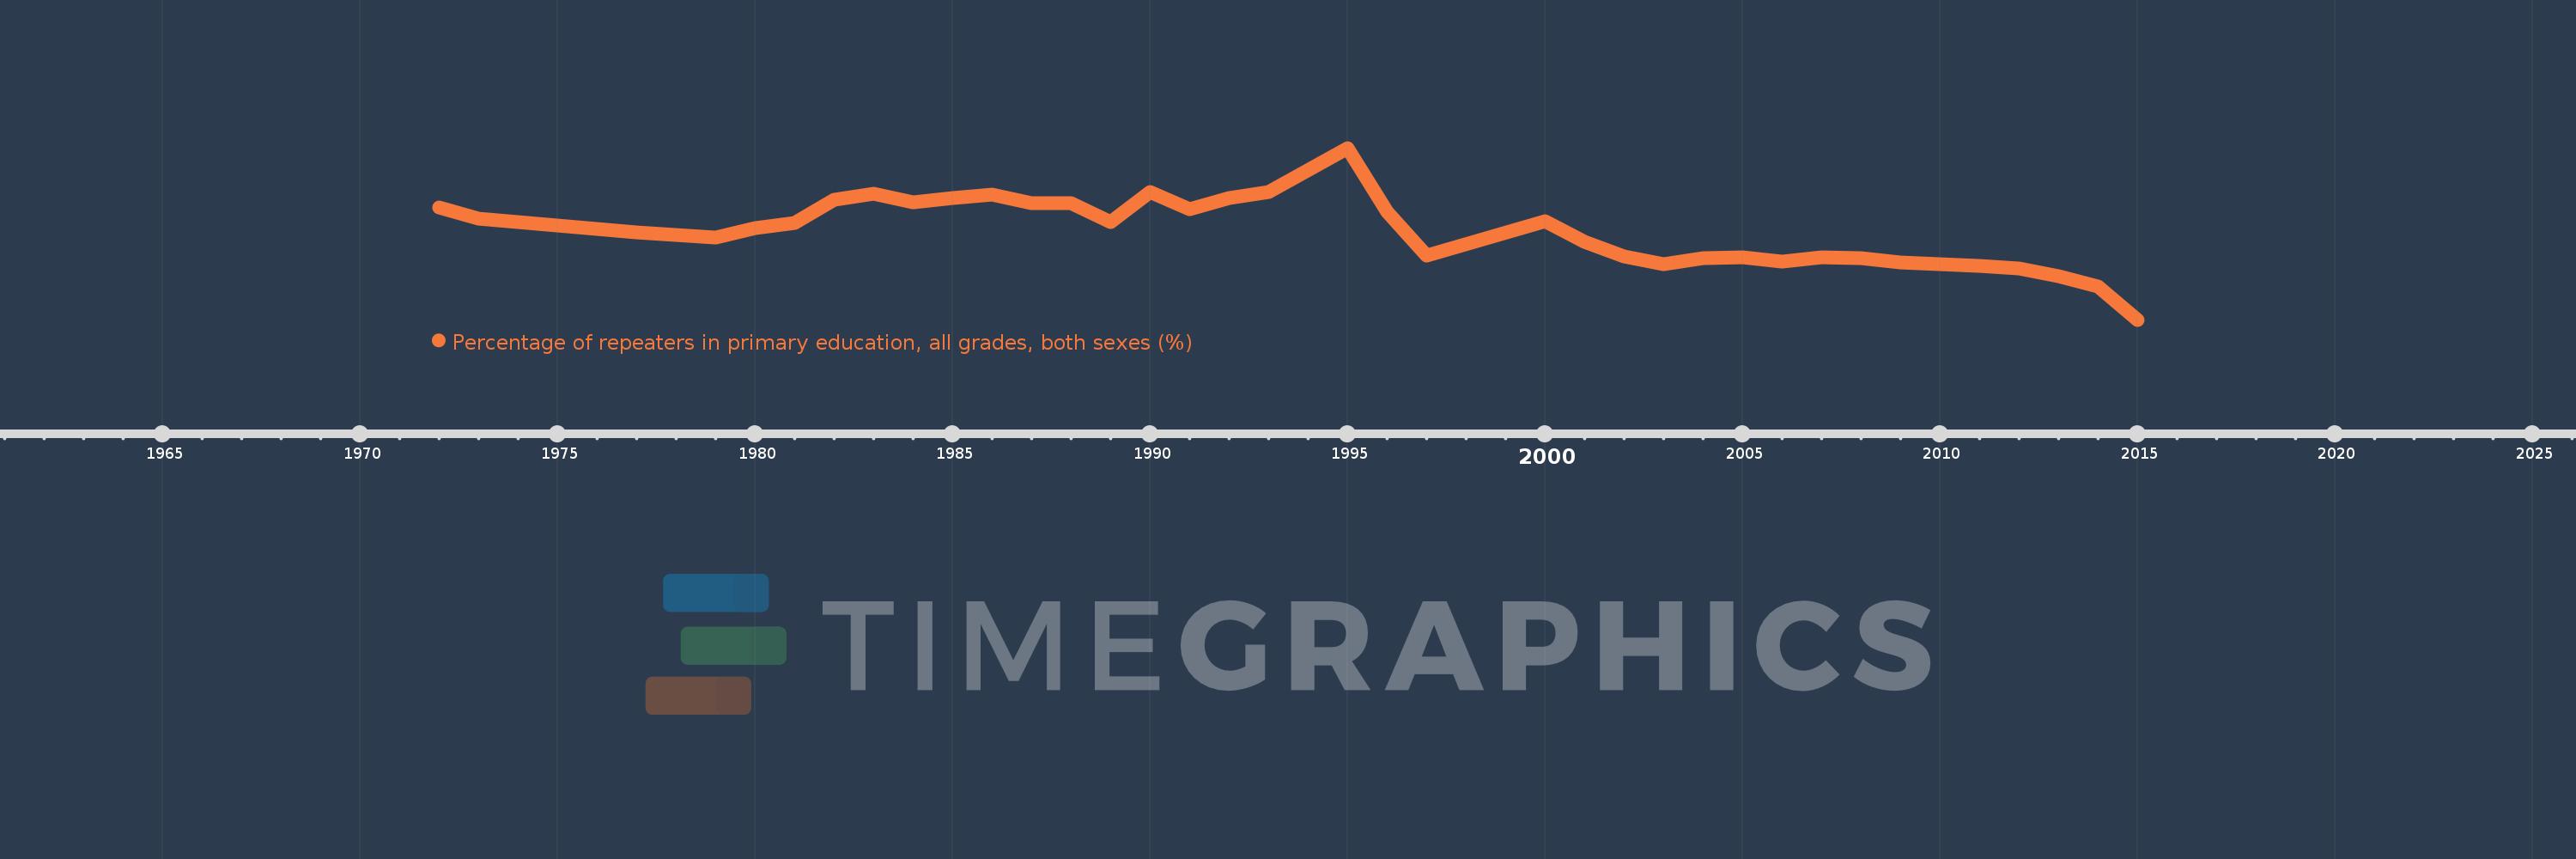
Percentage of repeaters in primary education, all grades, both sexes (%)
2015,2014,2013,2012,2011,2010,2009,2008,2007,2006,2005,2004,2003,2002,2001,2000,1997,1996,1995,1993,1992,1991,1990,1989,1988,1987,1986,1985,1984,1983,1982,1981,1980,1979,1977,1973,1972
Estas estadísticas en otros países:
AfghanistanAlbaniaAlgeriaAndorraAngolaAntigua and BarbudaArab WorldArgentinaArmeniaArubaAustriaAzerbaijanBahamas, TheBahrainBangladeshBelarusBelgiumBelizeBeninBermudaBhutanBoliviaBosnia and HerzegovinaBotswanaBrazilBritish Virgin IslandsBrunei DarussalamBulgariaBurkina FasoBurundiCabo VerdeCambodiaCameroonCanadaCaribbean small statesCayman IslandsCentral African RepublicCentral Europe and the BalticsChadChileChinaColombiaComorosCongo, Dem. Rep.Congo, Rep.Costa RicaCote d'IvoireCroatiaCubaCyprusCzech RepublicDenmarkDjiboutiDominicaDominican RepublicEarly-demographic dividendEast Asia & PacificEast Asia & Pacific (excluding high income)East Asia & Pacific (IDA & IBRD countries)EcuadorEgypt, Arab Rep.El SalvadorEquatorial GuineaEritreaEstoniaEthiopiaEuro areaEurope & Central AsiaEurope & Central Asia (excluding high income)Europe & Central Asia (IDA & IBRD countries)European UnionFijiFinlandFragile and conflict affected situationsFranceGabonGambia, TheGeorgiaGermanyGhanaGreeceGrenadaGuatemalaGuineaGuinea-BissauGuyanaHaitiHeavily indebted poor countries (HIPC)High incomeHondurasHong Kong SAR, ChinaHungaryIBRD onlyIcelandIDA & IBRD totalIDA blendIDA onlyIDA totalIndiaIndonesiaIran, Islamic Rep.IraqIrelandIsraelItalyJamaicaJapanJordanKazakhstanKenyaKiribatiKorea, Rep.KuwaitKyrgyz RepublicLao PDRLate-demographic dividendLatin America & Caribbean Latin America & Caribbean (excluding high income)Latin America & the Caribbean (IDA & IBRD countries)LatviaLeast developed countries: UN classificationLebanonLesothoLiberiaLibyaLiechtensteinLithuaniaLow & middle incomeLow incomeLower middle incomeLuxembourgMacao SAR, ChinaMacedonia, FYRMadagascarMalawiMalaysiaMaldivesMaliMaltaMauritaniaMauritiusMexicoMiddle East & North AfricaMiddle East & North Africa (excluding high income)Middle East & North Africa (IDA & IBRD countries)Middle incomeMoldovaMonacoMongoliaMontenegroMoroccoMozambiqueMyanmarNamibiaNauruNepalNetherlandsNew ZealandNicaraguaNigerNorwayOECD membersOmanOther small statesPacific island small statesPakistanPalauPanamaPapua New GuineaParaguayPeruPhilippinesPolandPortugalPost-demographic dividendPre-demographic dividendQatarRomaniaRussian FederationRwandaSamoaSan MarinoSao Tome and PrincipeSaudi ArabiaSenegalSerbiaSeychellesSierra LeoneSingaporeSint Maarten (Dutch part)Slovak RepublicSloveniaSmall statesSolomon IslandsSomaliaSouth AfricaSouth AsiaSouth Asia (IDA & IBRD)South SudanSpainSri LankaSt. Kitts and NevisSt. LuciaSt. Vincent and the GrenadinesSub-Saharan Africa Sub-Saharan Africa (excluding high income)Sub-Saharan Africa (IDA & IBRD countries)SudanSurinameSwazilandSwedenSwitzerlandSyrian Arab RepublicTajikistanTanzaniaThailandTimor-LesteTogoTongaTrinidad and TobagoTunisiaTurkeyTurks and Caicos IslandsTuvaluUgandaUkraineUnited Arab EmiratesUnited KingdomUpper middle incomeUruguayUzbekistanVanuatuVenezuela, RBVietnamWest Bank and GazaWorldYemen, Rep.ZambiaZimbabwe línea de tiempo (timeline):
En esta escala de tiempo se presenta un gráfico de 1972 y 2015 de Togo. Los datos de 1971 están ausentes. El número de observaciones reales por fecha: 37.
Fuente (nombre):
Indicadores del desarrollo mundial
Fuente (organización):
UNESCO Institute for Statistics
Categorías:
Education
Se ha actualizado:
23 abr 2017 año
Los indicadores de los cambios de valor en los últimos años
Mínimo:
11.2
1 ene 2015 año
Máximo:
45.955
1 ene 1995 año
A la fecha de observación
Valor
Cambio absoluto
El cambio con respecto al valor anterior
1 ene 1972 año
33.896
+33.896
0.0%
1 ene 1973 año
31.608
-2.288
-6.75%
1 ene 1977 año
28.811
-2.797
-8.85%
1 ene 1979 año
27.8
-1.011
-3.51%
1 ene 1980 año
29.807
+2.007
7.22%
1 ene 1981 año
30.866
+1.06
3.55%
1 ene 1982 año
35.501
+4.635
15.02%
1 ene 1983 año
36.778
+1.277
3.6%
1 ene 1984 año
34.881
-1.897
-5.16%
1 ene 1985 año
35.824
+0.943
2.7%
1 ene 1986 año
36.563
+0.739
2.06%
1 ene 1987 año
34.828
-1.736
-4.75%
1 ene 1988 año
34.709
-0.118
-0.34%
1 ene 1989 año
30.906
-3.803
-10.96%
1 ene 1990 año
37.089
+6.183
20.01%
1 ene 1991 año
33.612
-3.478
-9.38%
1 ene 1992 año
35.777
+2.166
6.44%
1 ene 1993 año
37.023
+1.245
3.48%
1 ene 1995 año
45.955
+8.933
24.13%
1 ene 1996 año
33.079
-12.876
-28.02%
1 ene 1997 año
24.217
-8.862
-26.79%
1 ene 2000 año
31.166
+6.949
28.69%
1 ene 2001 año
26.952
-4.213
-13.52%
1 ene 2002 año
24.006
-2.947
-10.93%
1 ene 2003 año
22.474
-1.532
-6.38%
1 ene 2004 año
23.676
+1.202
5.35%
1 ene 2005 año
23.836
+0.16
0.68%
1 ene 2006 año
22.923
-0.913
-3.83%
1 ene 2007 año
23.791
+0.868
3.79%
1 ene 2008 año
23.731
-0.06
-0.25%
1 ene 2009 año
22.843
-0.887
-3.74%
1 ene 2010 año
22.365
-0.479
-2.1%
1 ene 2011 año
22.129
-0.236
-1.05%
1 ene 2012 año
21.545
-0.584
-2.64%
1 ene 2013 año
19.987
-1.558
-7.23%
1 ene 2014 año
17.928
-2.059
-10.3%
1 ene 2015 año
11.2
-6.729
-37.53%
Ranking de los países por los datos estadísticos actuales


Comentarios: