29
/es/
es
AIzaSyAYiBZKx7MnpbEhh9jyipgxe19OcubqV5w
April 1, 2024
111392
Congo, Rep.
COG
true
2
1
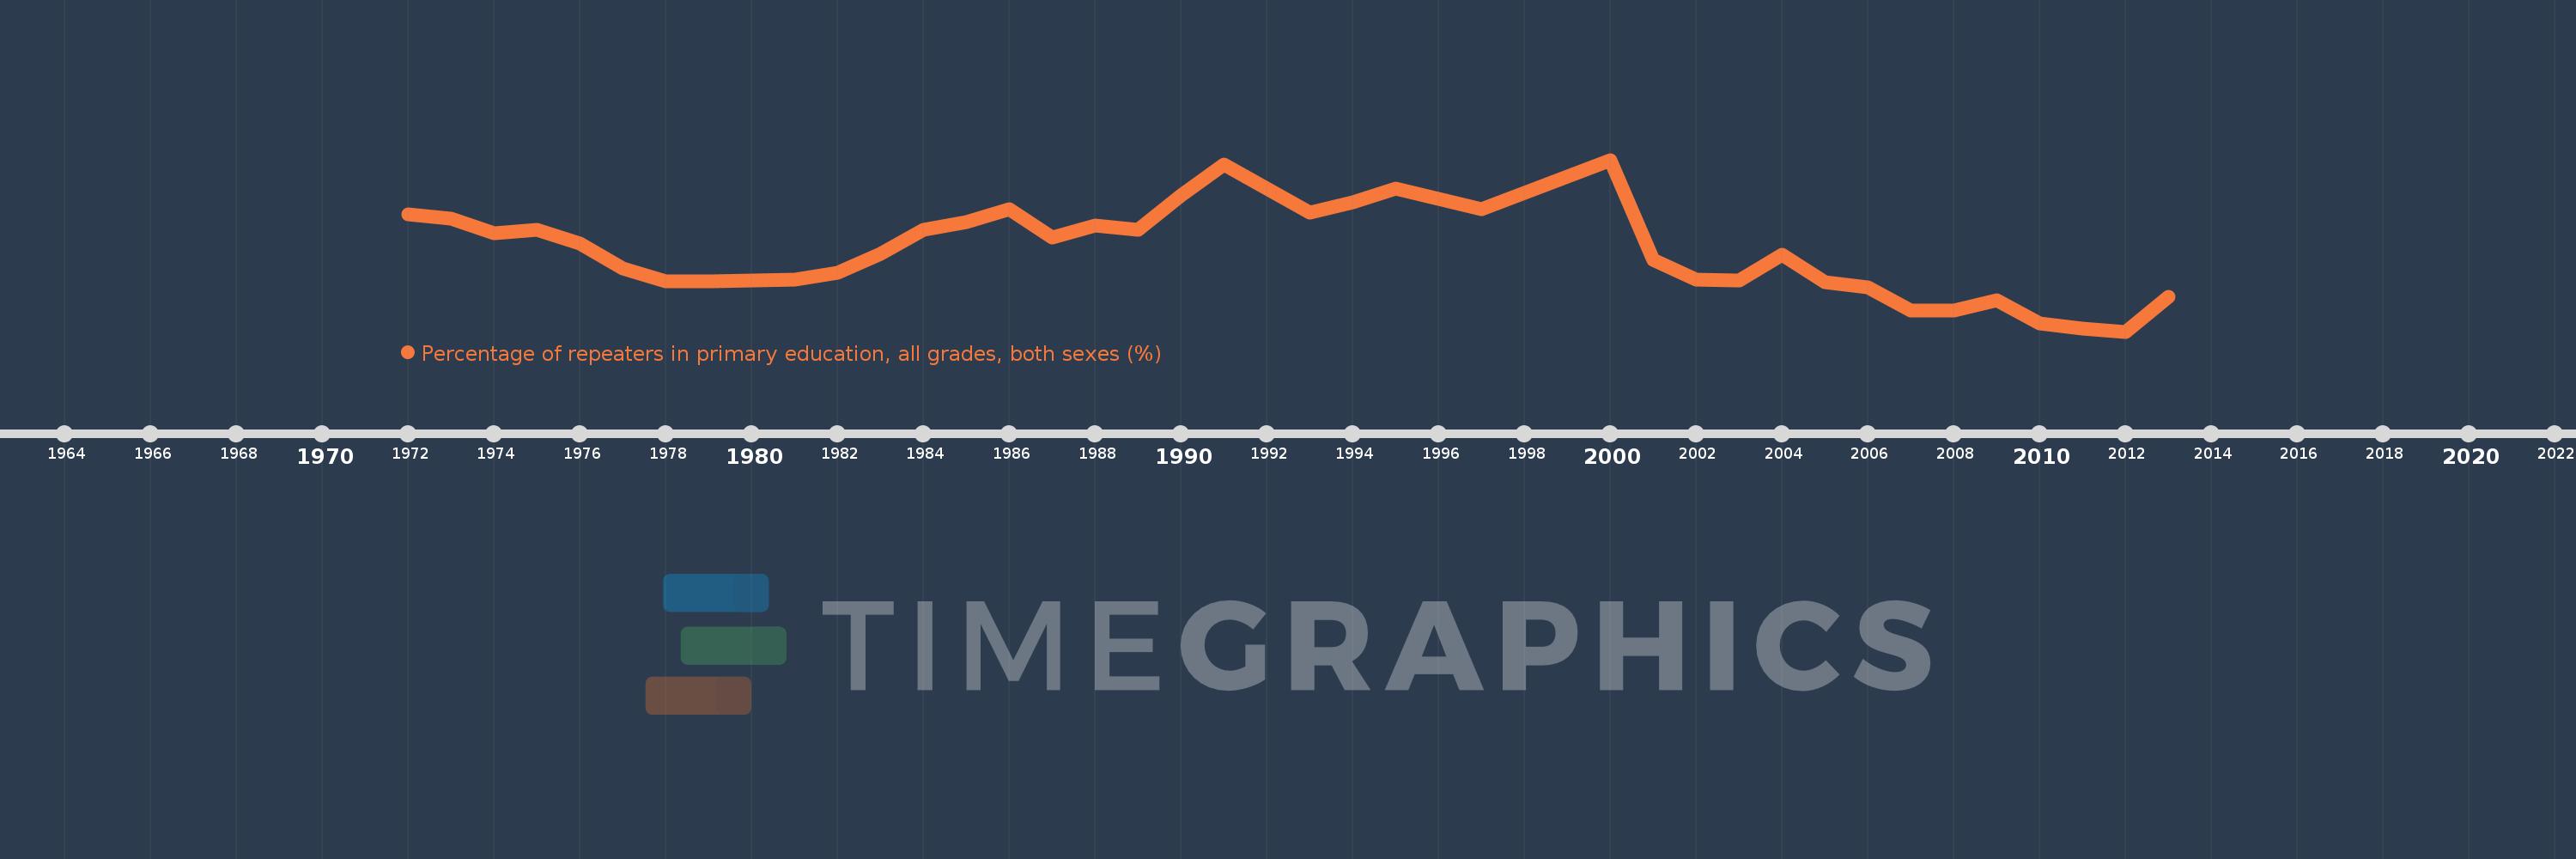
Percentage of repeaters in primary education, all grades, both sexes (%)
2013,2012,2011,2010,2009,2008,2007,2006,2005,2004,2003,2002,2001,2000,1997,1995,1994,1993,1991,1990,1989,1988,1987,1986,1985,1984,1983,1982,1981,1980,1979,1978,1977,1976,1975,1974,1973,1972
Estas estadísticas en otros países:
AfghanistanAlbaniaAlgeriaAndorraAngolaAntigua and BarbudaArab WorldArgentinaArmeniaArubaAustriaAzerbaijanBahamas, TheBahrainBangladeshBelarusBelgiumBelizeBeninBermudaBhutanBoliviaBosnia and HerzegovinaBotswanaBrazilBritish Virgin IslandsBrunei DarussalamBulgariaBurkina FasoBurundiCabo VerdeCambodiaCameroonCanadaCaribbean small statesCayman IslandsCentral African RepublicCentral Europe and the BalticsChadChileChinaColombiaComorosCongo, Dem. Rep.Congo, Rep.Costa RicaCote d'IvoireCroatiaCubaCyprusCzech RepublicDenmarkDjiboutiDominicaDominican RepublicEarly-demographic dividendEast Asia & PacificEast Asia & Pacific (excluding high income)East Asia & Pacific (IDA & IBRD countries)EcuadorEgypt, Arab Rep.El SalvadorEquatorial GuineaEritreaEstoniaEthiopiaEuro areaEurope & Central AsiaEurope & Central Asia (excluding high income)Europe & Central Asia (IDA & IBRD countries)European UnionFijiFinlandFragile and conflict affected situationsFranceGabonGambia, TheGeorgiaGermanyGhanaGreeceGrenadaGuatemalaGuineaGuinea-BissauGuyanaHaitiHeavily indebted poor countries (HIPC)High incomeHondurasHong Kong SAR, ChinaHungaryIBRD onlyIcelandIDA & IBRD totalIDA blendIDA onlyIDA totalIndiaIndonesiaIran, Islamic Rep.IraqIrelandIsraelItalyJamaicaJapanJordanKazakhstanKenyaKiribatiKorea, Rep.KuwaitKyrgyz RepublicLao PDRLate-demographic dividendLatin America & Caribbean Latin America & Caribbean (excluding high income)Latin America & the Caribbean (IDA & IBRD countries)LatviaLeast developed countries: UN classificationLebanonLesothoLiberiaLibyaLiechtensteinLithuaniaLow & middle incomeLow incomeLower middle incomeLuxembourgMacao SAR, ChinaMacedonia, FYRMadagascarMalawiMalaysiaMaldivesMaliMaltaMauritaniaMauritiusMexicoMiddle East & North AfricaMiddle East & North Africa (excluding high income)Middle East & North Africa (IDA & IBRD countries)Middle incomeMoldovaMonacoMongoliaMontenegroMoroccoMozambiqueMyanmarNamibiaNauruNepalNetherlandsNew ZealandNicaraguaNigerNorwayOECD membersOmanOther small statesPacific island small statesPakistanPalauPanamaPapua New GuineaParaguayPeruPhilippinesPolandPortugalPost-demographic dividendPre-demographic dividendQatarRomaniaRussian FederationRwandaSamoaSan MarinoSao Tome and PrincipeSaudi ArabiaSenegalSerbiaSeychellesSierra LeoneSingaporeSint Maarten (Dutch part)Slovak RepublicSloveniaSmall statesSolomon IslandsSomaliaSouth AfricaSouth AsiaSouth Asia (IDA & IBRD)South SudanSpainSri LankaSt. Kitts and NevisSt. LuciaSt. Vincent and the GrenadinesSub-Saharan Africa Sub-Saharan Africa (excluding high income)Sub-Saharan Africa (IDA & IBRD countries)SudanSurinameSwazilandSwedenSwitzerlandSyrian Arab RepublicTajikistanTanzaniaThailandTimor-LesteTogoTongaTrinidad and TobagoTunisiaTurkeyTurks and Caicos IslandsTuvaluUgandaUkraineUnited Arab EmiratesUnited KingdomUpper middle incomeUruguayUzbekistanVanuatuVenezuela, RBVietnamWest Bank and GazaWorldYemen, Rep.ZambiaZimbabwe línea de tiempo (timeline):
En esta escala de tiempo se presenta un gráfico de 1972 y 2013 de Congo, Rep.. Los datos de 1971 están ausentes. El número de observaciones reales por fecha: 38.
Fuente (nombre):
Indicadores del desarrollo mundial
Fuente (organización):
UNESCO Institute for Statistics
Categorías:
Education
Se ha actualizado:
23 abr 2017 año
Los indicadores de los cambios de valor en los últimos años
Mínimo:
18.697
1 ene 2012 año
Máximo:
39.101
1 ene 2000 año
A la fecha de observación
Valor
Cambio absoluto
El cambio con respecto al valor anterior
1 ene 1972 año
32.614
+32.614
0.0%
1 ene 1973 año
32.138
-0.477
-1.46%
1 ene 1974 año
30.37
-1.767
-5.5%
1 ene 1975 año
30.755
+0.385
1.27%
1 ene 1976 año
29.153
-1.603
-5.21%
1 ene 1977 año
26.148
-3.005
-10.31%
1 ene 1978 año
24.713
-1.435
-5.49%
1 ene 1979 año
24.619
-0.094
-0.38%
1 ene 1980 año
24.726
+0.107
0.43%
1 ene 1981 año
24.838
+0.112
0.45%
1 ene 1982 año
25.709
+0.871
3.51%
1 ene 1983 año
27.891
+2.182
8.49%
1 ene 1984 año
30.762
+2.871
10.29%
1 ene 1985 año
31.73
+0.969
3.15%
1 ene 1986 año
33.201
+1.471
4.64%
1 ene 1987 año
29.855
-3.346
-10.08%
1 ene 1988 año
31.31
+1.455
4.87%
1 ene 1989 año
30.82
-0.49
-1.57%
1 ene 1990 año
34.845
+4.025
13.06%
1 ene 1991 año
38.516
+3.671
10.54%
1 ene 1993 año
32.79
-5.726
-14.87%
1 ene 1994 año
34.033
+1.243
3.79%
1 ene 1995 año
35.657
+1.624
4.77%
1 ene 1997 año
33.221
-2.436
-6.83%
1 ene 2000 año
39.101
+5.88
17.7%
1 ene 2001 año
27.224
-11.877
-30.38%
1 ene 2002 año
24.916
-2.309
-8.48%
1 ene 2003 año
24.756
-0.16
-0.64%
1 ene 2004 año
27.819
+3.063
12.37%
1 ene 2005 año
24.544
-3.275
-11.77%
1 ene 2006 año
23.946
-0.597
-2.43%
1 ene 2007 año
21.218
-2.728
-11.39%
1 ene 2008 año
21.219
+0.0
0.0%
1 ene 2009 año
22.404
+1.186
5.59%
1 ene 2010 año
19.663
-2.741
-12.24%
1 ene 2011 año
19.082
-0.581
-2.95%
1 ene 2012 año
18.697
-0.385
-2.02%
1 ene 2013 año
22.791
+4.094
21.9%
Ranking de los países por los datos estadísticos actuales


Comentarios: